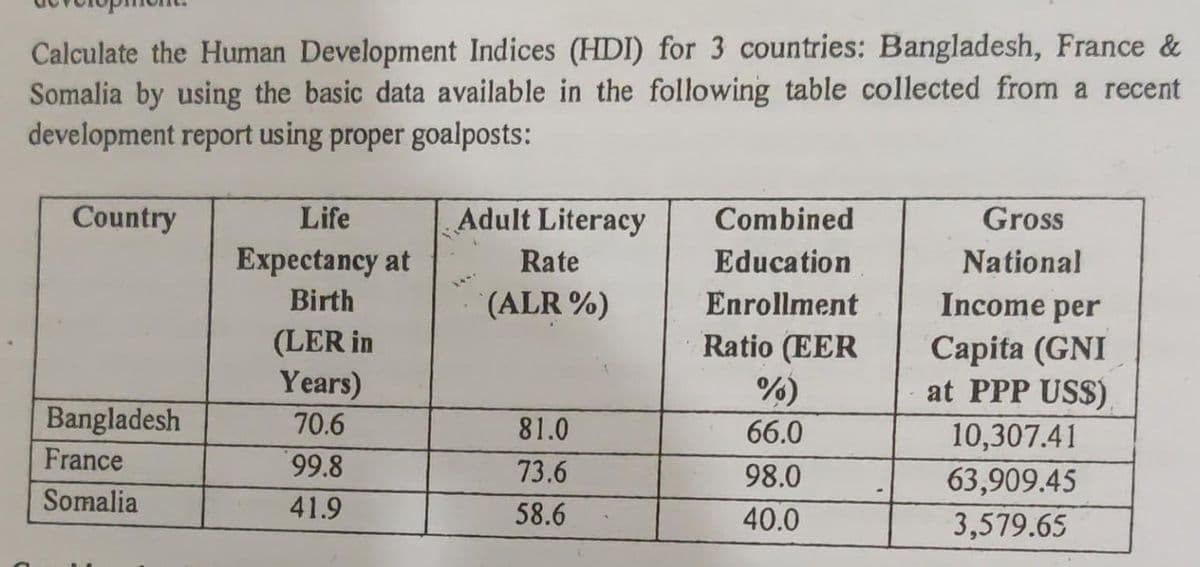
Calculate the Human Development Indices (HDI) for 3 countries: Bangladesh, France & Somalia by using the basic data available in the following table collected from a recent development report using proper goalposts: Country Life Adult Literacy Combined Gross Expectancy at Rate Education National Birth (ALR %) Enrollment Income per (LER in Years) Ratio (EER Capita (GNI at PPP USS) %) Bangladesh 70.6 81.0 66.0 10,307.41 France 99.8 73.6 98.0 63,909.45 Somalia 41.9 58.6 40.0 3,579.65
Q: Explore 05 yearly data of the following indicators with respect to Pakistan in graphical as well as…
A: Year GDP (Rs. Million) GNP (Rs. Million) NDP (Rs. Million) NNP (Rs. Million) 1999-00…
Q: Using a table and a line graph showing the unemployment and economic growth rate for Jamaica and…
A: Generation of the unemployment and economic growth in such a way that even country which can be the…
Q: 1. GDP is abbreviation of a) General Gross Price c) Gross Development Projects b) Gross Domestic…
A: Since you have posted a question with multiple sub-parts, we will solve the first three sub-parts…
Q: Gross domestic product (GDP) data are used as a means to measure welfare. to observe long-run growth…
A: GDP is significant since it gives information about an economy's size and health. The rate of…
Q: Countries are being classified/categorised based on economic, social, environmental indicators.…
A: The standard proportion of the worth added created by the creation of labor and products in a…
Q: (a) Find the quadratic function that best models the developing economies' share of the global GDP…
A: Solution- Quadratic regression equation, y =ax^2+bx+cy=ax2+bx+c taking x = input/independent…
Q: Pakistan’s HDI value and rank Pakistan’s HDI value for 2019 is 0.557— which put the country in the…
A: Answer: HDI is a measure of majorly four parameters, it includes life expectancy for health,…
Q: please identify from the following statements the two valid interpretations. A) The upper-middle…
A: Income disparity refers to how income is distributed unequally across a population. The more unequal…
Q: Discuss the limitations of the use of the Gross Domestic Product(GDP) as a measurement of…
A: The total worth of products and services produced in an economy during a given time period is…
Q: The data below are from the economies of Ishgandar and Nonburmia. Ishgandar Nonburmia GDP Nominal…
A: Disclaimer: As per Bartelby guidelines, in the case of multiple questions, only the first one will…
Q: The text makes numerous cross-country comparisons, but that does not mean that we have to restrict…
A: The table presents the data for the per capita real GDP for six states in the U.S. between 1997 and…
Q: With the use of GDP data over a 25 year period assess the main source of economic growth in Barbados…
A: Economic growth is the increment in the production rate of products and services in an economy.
Q: Micro Economics studies about aggregated indicators such as GDP, unemployment rates, price indices…
A: Microeconomics is that branch of economics where we study the economic problem and issue at small…
Q: Human Development Index
A: The ‘human development index’ or HDI is a statistical measure of education, life expectancy and per…
Q: HDI Data for Selected Countries in 2015 Life Expectancy at Birth Expected Years of Schooling at…
A: The following problem has been answered as follows:
Q: Is there any relationship between human development index and happiness index? Evaluate countries by…
A: HDI, human development index is the composite form of representing the standard in terms of…
Q: Real per capita GDP in the United States in 2015 was approximately.
A: Real GDP is the GDP which is adjusted to the inflation
Q: Which of the following is not one of the main indicators to measure wealth in a country? Group of…
A: Wealth A collection of valuable economic resources that can be measured in real or monetary terms…
Q: status of the Philippines from
A: Economic growth is defined as the increase in the inflation-adjusted market value of the services…
Q: Country Z INDICATOR NOW 1 YEAR AGO GDP growth rate 3.7% 3.5% Explain if each country is healthy.…
A: In an economy, an economy's growth and development can be analyzed using economic tools/measures…
Q: MODIFIED TRUE OR FALSE Development indicators are statistics which are used to rank countries and…
A: When talking abou financial indicators in economics, it can be said that these are the economic…
Q: This is not a writing assignment, this is a multiple-choice question Which of the below statements…
A: GDP per capita = GDP / Population of the country In real terms, real GDP of India is greater than…
Q: Broken window fallacy pertains to: errors in estimating the GDP figures neglect of short term…
A: In economics, the broken window fallacy refers to the economic situation when an economy is…
Q: State THREE specific reasons that could account for the differences in the unemployment rate in a…
A: To state the causes behind the unemployment in a developing economy and how it differs from the…
Q: Which of the following are the different indicators included in the Human Development Index (HDI)?…
A: The Human Development Index is a measurement that helps to evaluate the level of individual human…
Q: “The GDP of a country does provide an accurate indicator of the welfare of its citizens”
A: GDP refers to the monetary value of total output produced in the economy for a specific year. And…
Q: The main advantage of 'human development Index' over conventional measures such as 'gross national…
A: The Human Development index was envisaged as a more well-rounded and holistic approach to measuring…
Q: Analyze the Human Development Index rate of the Philippines over the years, interpret and write its…
A: Given that: Year HDI HDI Ranking 2019 0.718 107 2018 0.711 111 2017 0.706 111 2016 0.704…
Q: • The economic growth is recognized (measured) as an increase in real GDP. • Literacy rates, life…
A: Economic growth is described as a process in which the output of commodities and services increases…
Q: Suppose that there is a country with the following data for the year 2004: Indicator Life Expectancy…
A: The Human Development Index or HDI calculates a country's development through the four factors: mean…
Q: Cross country comparisons of GDP per capita typically use purchasing power parity equivalent…
A: Purchasing power parity (PPP) is a theory that makes the contrast of the purchasing power of…
Q: The following table shows hypothetical values for the real GDP and population for the United States,…
A: Real GDP per Capita is calculated by dividing Real GDP divided by the population of the country.…
Q: The following data relate to an emerging African country. Item…
A: All the parts have been solved below.
Q: Complete the table by calculating real GDP and real GDP per capita from 2014 to 2017 using the data…
A: Given:- Year population size price level index nominal GDP real GDP real GDP per capita 2014…
Q: Muscat Municipality maintains lots of data about its daily work activities. Give an example of…
A: Master Data:- Master data includes the data for various categories inside the Muscat Municipality…
Q: Which of the equations given below regarding national calculations is correct? A) GDP -…
A: Whatever formulas are given,among them only one formula is correct. Whatever national income is…
Q: Imagine the GDP per capita of a country doubles every one hundred years. What would the shape of a…
A: Gross domestic product divided by midyear population equals GDP per capita. Gross domestic product…
Q: We measure standards of living using GDP per capita. Using the production function, which of the…
A: Total production function shows the how each inputs determine the total output For example,…
Q: If the GDP deflator is greater than 100, then A) nominal GDP is greater than real GDP. B) nominal…
A: GDP Deflator is given by the formula GDP Deflator =(Nominal GDP / Real GDP )*100
Q: We measure standards of living using GDP per capita. Using the production function, which of the…
A: Total production function shows the how each inputs determine the total output For example,…
Q: the measurement method of per capita income in Turkey has been changed in 2016. What is wrong with…
A: It is understood that the greatest challenge to using real GDP to gauge our standard of living lies…
Trending now
This is a popular solution!
Step by step
Solved in 3 steps
- Using the information provided in Table 1 below for the Traditional Human Development Index, answer the following questions: Hypothetical Data for Malaysia Economic Indictor Value PPP GDP per capita $ 13,990 Life Expectancy 79 Adult literacy 86% Gross School Enrollment 82% Calculate the income index, life expectancy index, and education index for Malaysia .Based on the above data answer the following for Country X:(a) Calculate the income index (b) Calculate the education index(c) Calculate the health index (d) What is the value of the country’s Human Development Index (HDI)? (e) From your answer in part (d) Country X should fall under which of the four HDI groups?State using supportive research whether GDP should be used as a basis to measure a country’s development in comparison to the multiple dimensional poverty index.
- INSTRUCTION Given the following data for the year 2020, compute for the: Birth rate Death rate Maternal mortality rate Fertility rate Infant mortality rate GIVEN: Live births = 300 infants Still births = 5 infants Deaths before 1 month old= 15 infants Women in their reproductive age = 2,000 women Total Population = 10,000 people Deaths = 100 people (across all age groups)Based on the hypothetical information given below, analyze which country is in better position and give reason for both the indicators given below. Indicator Sri Lanka Bangladesh Gini Coefficient 0.35 0.55 HDI 0.780 0.635 Kuznets Ratio 4.05 5.35The source for this dataset is The World Bank. data.worldbank.org/indicator/NY.GDP.PCAP.CD(a) In 2022, what are the 6 richest countries in the world?(b) In 2022, what are the 6 poorest countries in the world(c) In 2022, how many times richer is the average person of the richest country thanthe average person of the poorest country in the world?2. For the countries that have data for 1960, compute the average ANNUAL growth rate ofper capita GDP between 1960 and 2022.(a) What 5 countries have grown the MOST over this period? What are their growthrates?(b) What 5 countries have grown the LEAST over this period? What are their growthrates?3. Write down some of your thoughts about WHY some countries are rich and some countriesare poor.
- Identify ONE way that the data in the chart illustrate global economic differences between countries in the late twentieth century. b) Identify ONE similarity (other than GDP per capita) that might account for the low life expectancies of some of the world’s countries, as displayed in the chart. c) Explain ONE way in which longer life expectancies in some of the world’s countries, as displayed in the chart, have led to new political, economic, or social problems.With reference to measurements of the dimensions of the Human Development Index which of the following statement is incorrect? a. No of households in a family b. A long and healthy life is measured by life expectancy at birth c. A decent standard of living is measured by GDP per capita in purchasing Power Parity (PPP) US Dollars d. nowledge is measured by the adult literacy rate (with two thirds weight) and the combined primary, secondary and tertiary gross enrolment ratio (with one third weight)Conduct a web search and summarize the core-periphery spatial relationshipof each of the four (4) countries being south africa, India, Jamiaca and Brazil.
- 10) True or False: Countries that currently have low real GDPs per capita are destined to always have lower living standards than countries that currently have high real GDPs per capita.Match the following terms and definitions.____ a. fertility____ b. crude death rate____ c. crude birth rate____ d. demography____ e. fecundity____ f. age-specific fertility____ g. age-specific death rate____ h. infant mortality rate____ i. migration____ j. gross migration rate____ k. net migration rate____ l. morbidity(1) the number of deaths per 1,000 members of a population per year(2) the movement of people from one geographical area to another for the purpose of establishing a new residence(3) the increase or decrease per 1,000 members of a population per year as a result of people leaving and enteringthe population(4) the number of live births per 1,000 women aged fifteen to forty-four years(5) the number of deaths per 1,000 persons in a specific age group(6) the study of the growth, distribution, composition, and change of a population(7) the number of live births per 1,000 women in a specific age group(8) the number of persons per 1,000 members of a population who enter or leave…A key theme of criticism of globalization is that it seems to unfairly reward the rich and punish the poor. One way to think about this is to look at the issue of income inequality. Technically, income inequality is the unequal distribution of household or individual income across the various participants in an economy. Income inequality is often presented as the percentage of income to a percentage of population. For example, a statistic may indicate that 70% of a country's income is controlled by 20% of that country's residents. Work on income inequality in the USA shows the change in income between 1980 and 2014 for every point on the distribution of people in terms of income percentile that is, we can track the changing distribution of income, from the poorest person to the richest person over that time span. As seen in the chart below, it’s mostly flat and close to zero, before spiking upward at the end—as such, some say it resembles a classic hockey-stick graph. Based on this…