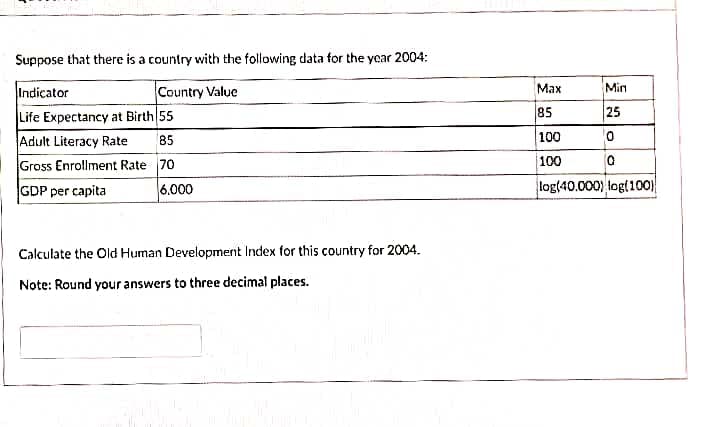
Suppose that there is a country with the following data for the year 2004: Indicator Life Expectancy at Birth 55 Adult Literacy Rate 85 Gross Enrollment Rate 70 GDP per capita Country Value 6.000 Calculate the Old Human Development Index for this country for 2004. Note: Round your answers to three decimal places. Min 25 0 Max 85 100 100 log(40.000) log(100) 0


Q: the mahogany cabinet and furniture company makes chairs. the fixed coat per month of making chairs…
A:
Q: Companies like Amazon and Facebook and Google are so dominant that they really have very little…
A: Oligopoly and Monopoly An oligopoly is a form of market where there are a few larger numbers of…
Q: Which of the following features is not possible in a game tree?
A: An information set is used to convert simultaneous extensive form games to strategic form games.…
Q: Shawn Pen & Pencil Sets Inc. has fixed costs of $421,400. Its product currently sells for $18 per…
A: Change in break-even point is witnessed when one of its elements, namely, fixed cost, variable cost,…
Q: Which of the following is a very important tip you should do before submitting your cover letter?
A: b) Have someone else read it
Q: Determine the amount needed now to purchase a machine for P200,000, provide an annualfund of P15,000…
A: Given that, The initial Cost of the Machine = P200,000 Annual Cost of the Machine = P 15,000…
Q: Predict the demand for December using 4-period moving average.
A: To compute 4 month average for December Use the four months before it. Average Aug, Sep, Oct and Nov…
Q: The demand for Widgets (QX) is a function of the price of widgets (PX), the price of woozle (PY),…
A: Note:- Since we can only answer up to three subparts, we'll answer the first three. Please repost…
Q: GDP for Wakanda was $156 billion. • Firms owned 100% by foreigners earned $3 billion in Wakanda. •…
A: Gross national product is an estimate of the all out value of the relative multitude of final…
Q: 1. We have a population of 3, they have the following benefit curves (TB): TB¹ = 3q - 2q² TB² = 2q -…
A: Total Benefit refers to the benefit that a certain public or private good gives or offers to its…
Q: There are two workers. Each worker's demand for a public good is P= 20 - Q. The marginal cost of…
A: A "socially optimum solution" is what economists refer to when they talk about "the ideal allocation…
Q: Since it is counted as an investment, why doesn't the purchase of equipment from Caterpillar (a U.S.…
A: Gross domestic product (GDP) measures the market value of final goods and services produced within…
Q: Q3. d) Suppose the interest rate rises. Then you will you save more while wor Select one: True False
A: An interest rate is basically determined as the certain value of the principal amount of overall…
Q: II. Performance Appraisal Using the Paired-Comparison for the following employees. method of…
A: The goal of the employee comparison pairs created in the paired comparison technique of performance…
Q: is(Enter your response rounded to the nearest whole number) The forecast for week 13 is
A: 13 751
Q: If the total budget expenditure is 6200 and the total budget receipts are 1300 find the budgetary…
A: The budget deficit is the excess of the expenditure over the receipts of government. The budget…
Q: Twenty years from now, Angelo plans to buy a new motorbike worth BD10,000. The current rate of…
A: FV = 10,000 r = 8% n = 20
Q: [Related to Solved Problem 3.18] Some companies offer their employees defined benefit pension plans.…
A: Discount Rate is the rate at which future value or a series of future cash flows are discounted to…
Q: What is the primary task of a mechanism design economist? To inform consumers about the role of…
A: Mechanism design helps to keep the interests of two different parties in an alignment for a…
Q: Explain the two different concepts of purchasing power parity PPP and how they relate to the Law of…
A: Exchange rate - The exchange tells us about the worth of the currency of one country in comparison…
Q: With respect to your knowledge of the economic impact of the coronavirus outbreak, explain how the…
A: Aggregate supply is an economy's gross domestic product (GDP), the total amount a nation produces…
Q: 7. In reality, if a nation devalues its currency, then the final result will be that: Multiple…
A: Since you have asked multiple questions, we will solve the first question for you. If you want any…
Q: A local company is planning to manufacture and market a four-slice toaster. For this toaster, the…
A: Weekly Demand = 300 toasters @ $25 each and Weekly Demand = 400 toasters @ $20 each Note:- Since…
Q: Spaniards can produce 10 gallons of wine or 8 gallons of olive oil per worker hour. Americans can…
A: Note:- Since we can only answer one question at a time, we'll answer the first one. Please repost…
Q: 6. The Role of Government: Tax and plastic bags A. In the diagram, identify the lines that express…
A: c) The impact of tax depends on the elasticities of demand and supply curves i.e. the responsiveness…
Q: Lorelai's choice behavior can be represented by the utility function u(x₁, x₂) = 0.9ln(x₁) + 0.1x2.…
A:
Q: gdp?asap
A: GDP = C + I + G + NX C - Consumption I - Investment G- Government expenditure Nx - Net export
Q: 8. Problems and Applications Q Suppose that in a year an American worker can produce 100 shirts or…
A: A country has comparative advantage in production of a particular good when it is able to produce…
Q: 7. The freerider problem can be overcome by public service announce- ments or campaigns attempting…
A: The freerider problem occurs where the people enjoy the benefits of goods or services but not ready…
Q: A monopolist options: always earns profits in the long run. may earn profits in the long…
A: A monopolist is the market where there are many buyers but only one seller. In this market product…
Q: Tom spends all his weekly income on two goods, apples and bananas. His utility function is given by…
A: Given Information: U = A0.5 B0.5 Where U is utility A is the quantity of apples. B is the quantity…
Q: What is wrong with this answer?
A: The correct answer is No one would have an incentive to work once they had earned $200,000, so…
Q: 6) You have a balance of $7500 on your credit card and you make no further charges. If your APR is…
A: An interest rate is the level of chief charged by the lender for the utilization of its cash. The…
Q: The graph on the right shows the demand for and supply of labor in a market with an equilibrium wage…
A: Equilibrium in the labor market occurs at the intersection of demand and supply curves.
Q: 3 . Measuring GDP The following table shows data on consumption, investments, exports, imports, and…
A: Given Consumption expenditure C =12,757.9 billions of dollars Investment expenditure I = 3,035.7…
Q: What is demand? (
A: Demand is a powerful economic factor because it drives businesses to produce, develop supplies, and…
Q: 1. Firms can expand or contract based on market conditions 2. Capital is fixed ? 3. Firms face…
A: Workers Total Output Marginal Product 0 0 -- 1 65 65 2 98 33 3 110 12 4 112 2 5 112…
Q: Calculate the Money Multiplier, Excess Reserves, Required Reserves and Total Potential Deposit…
A: Given that, rrr = .12 Total Deposits = $6300 Total Reserves = $5500
Q: 1. The following questions are related to the Real Business Cycles (RBC) Model. (a) What are the…
A: Real business cycle hypothesis is the most recent manifestation of the old style perspective on…
Q: What is neoclassical growth model of economic growth?
A: Economic Growth When economic growth is defined as a rise in people's real income it indicates that…
Q: Two mutually exclusive projects are being considered: Project Uno has a first cost of $12,500,…
A:
Q: he end of the year: you sell trees Lei cut down for $27,000; you pay Lei $15,000; and your saw is…
A: GDP is the aggregate value of goods and services produced within the domestic territory of a nation…
Q: OE D OB в. 2 E agriculture Co Here's a production possibility frontier graph. In this example....…
A: The Production Possibilities Frontier (PPF) graph shows all the output combinations of two products…
Q: ous cross-country comparisons, but that does not mean that we have to restrict our analysis to…
A: To calculate the average growth rate of your company, you first need to divide the present by the…
Q: In a credit market, type B borrowers repay 89% of the time and type C repay 76% of the time. They…
A: The relative pooling rate is the amount of credits that are anticipated to be repaid given the…
Q: Use the table below to calculate core and headline inflation in each time frame relative to the base…
A: Core and headline inflation:- Headline inflation is the unprocessed inflation rate as measured by…
Q: Which statement matches the evidence presented in the trade and inequality podcast best? Trade makes…
A: Note: We will answer the first question as the exact one was not specified. Please resubmit a new…
Q: Suppose that the money market can be depicted in the graph below. Interest rate (M³/P)⁰ (M³/P)1…
A: Disposable pay is the cash you have left from your pay after you pay bureaucratic, state, and…
Q: Why do most modern societies try to reduce poverty? What is the most effective way to reduce poverty…
A: Poverty refers to the condition of living or living standard where one does not have the basic…
Q: Determine the size of the market surplus or shortage that would es a price of $40. There will be a…
A: - Diagram

Step by step
Solved in 5 steps


- Suppose we have the following data given to us in this table. Year Real GDP Nominal GDP Population 2010 11,306 12,860 50 2020 12,844 13,382 47 Given this data, we would expect the quality of life to have increased by what percentage over the last 10 years? Answer this as a percentage and round your answer to two digits after the decimal without the percentage sign. ex. If you found the rate to be 5.125%, answer 5.13.INSTRUCTION Given the following data for the year 2020, compute for the: Birth rate Death rate Maternal mortality rate Fertility rate Infant mortality rate GIVEN: Live births = 300 infants Still births = 5 infants Deaths before 1 month old= 15 infants Women in their reproductive age = 2,000 women Total Population = 10,000 people Deaths = 100 people (across all age groups)Q6. Explain and compare Pakistan’s HDI score with regional countries. Answer this question with respect to the data mentioned below HDI value HDI rank Life expectancy at birth Expected years of schooling Mean years of schooling GNI per capita (2017 PPP US$) Pakistan 0.557 154 67.3 8.3 5.2 5,005 Bangladesh 0.632 133 72.6 11.6 6.2 4,976 India 0.645 131 69.7 12.2 6.5 6,681 South Asia 0.641 — 69.9 11.7 6.5 6,532 Medium HDI 0.631 — 69.3 11.5 6.3 6,153
- G. Menges developed the following econometric model for the West German economy*: Yt = β0 + β1Yt−1 + β2 It + u1tIt = β3 + β4Yt + β5 Qt + u2tCt = β6 + β7Yt + β8Ct−1 + β9 Pt + u3tQt = β10 + β11 Qt−1 + β12 Rt + u4t where Y = national incomeI = net capital formationC = personal consumptionQ = profitsP = cost of living indexR = industrial productivityt = timeu = stochastic disturbances Required: a. Which of the variables would you regard as endogenous and which asexogenous?b. Is there any equation in the system that can be estimated by thesingle-equation least-squares method?c. What is the reason behind including the variable P in the consumption function?No written by hand solution The table below shows national data for the economy of Westfall. Round your intermediate calculations to one decimal place. Enter your responses rounded to one decimal place with the exception of Real GDP per capita that can be entered as a whole number. a. Fill in the blanks in the table below. 201820192020Nominal GDP (in billions)$650$730$ GDP deflator (2010 = 100)112 121Real GDP (in billions)$ $617$ Population (in millions)44 45Real GDP per capita$ $13,854$14,349 b. The inflation rate in 2019 is %. c. The growth rate of real GDP per capita in the year 2020 is %.Question 2 Calculate new HDI for Egypt using the given actual values from Egypt: Actual life expectancy at birth: 73.5 Mean years of schooling: 6.4 Expected years of schooling: 12.1 GNI per capita: 5,401 How would you classify Egypt based on the NHDI you found? Click on reveal once you are done calculating NHDI (0.662) Full explain this question and text typing work only thanks
- Year Real GDP per Capita 1985 6,000 1986 6,300 1987 6,700 1988 7,200 1989 7,850 1990 8,250 1991 8,450 1992 8,550 1993 8,575 1994 8,510 1995 8,370 1996 8,100 1997 7,950 1998 7,925 1999 7,960 2000 8,035 2001 8,155 The information above describes the real GDP per capita for a country for the period from 1985 through to 2001. I.…Gross domestic product per capita is the ratio of total gross domestic product to population.gross domestic product, a unit of timemonetary value of the final goods and services produced in the economy (let be in TL) and population, unitaccording to the number of people in that economy at the time,a) write down the unit of measure and size of the gross domestic product variable per capita. b) what is the relationship between gross domestic product per capita, total gross domestic product and population growth?Express your conclusions in a sentence by making inferenceConsider the following data on the Pakistan economy:Nominal GDP GDP Deflator Year (in billions of rupees) (base year 2012)2018 21,501 111.4 1998 9,163 76.3 i. What was the growth rate of nominal GDP between 1998 and 2018? (Hint: The growth rate of a variable X over an N-year period is calculated as [(Xfinal/Xinitial)1/N – 1] x 100). ii. What was the growth rate of the GDP deflator between 1998 and 2018? iii. What was real GDP in 1998 measured in 2012 prices? iv. What was real GDP in 2018 measured in 2012 prices? v. What was the growth rate of real GDP between 1998 and 2018? vi. Was the growth rate of nominal GDP higher or lower than the growth rate of real GDP? Explain.
- These data are for illustrative purpose only not in anyway representing Namibia stats in 2019 2019 Population 2,582,598 Male 1,255,688 Female 1,326,910 Population working age 15+ years Total (PWA) 1,639,205 Labour Force 1,166,464 Employed 776,544 Male employed 386,814 Female employed 390,372 Male labour force 572,891 Female labour force 594,215 Youth labour force 616,988 Youth employed 332,614 Use the information provided in the table above to calculate: a) Labour force participation rate b) Labour force absorption rate c) Namibia unemployment rate in 2019 d) Male absorption rate e) Female absorption rate f) Male…Economic growth around the world The following table reports real income per person for several different economies in the years 1960 and 2010. It also gives each economy's average annual growth rate during this period. For example, real income per person in Niger was $945 in 1960, and it actually declined to $570 by 2010. Niger's average annual growth rate during this period was -1.01%, and it was the poorest economy in the table in the year 2010. The real income-per-person figures are denominated in U.S. dollars with a base year of 2005. The following exercises will help you to understand the different growth experiences of these economies. Economy Real Income per Person in 1960 Real Income per Person in 2010 Annual Growth Rate (Dollars) (Dollars) (Percent) Canada 12,946 35,810 2.06 United Kingdom 11,884 32,034 2.00 Korea 1,610 28,702 5.93 Hong Kong 4,518 44,070 4.66 Guatemala 1,985 3,859 1.34 Niger 945 570 -1.01 Indicate which economy…In the last century, Tunisia’s Gross Domestic Product (GDP) has grown rapidly on average 5% per annum. However, as a result of the political, economic and geopolitical turmoil faced, the economic situation of the country has been affected since 2009. GDP per capita in 2009 was USD4130. While in 2017, GDP per capita Tunisia is USD3491. In a situation that remains the same, how many years will Tunisia be able to doubling the per capita GDP achieved in 2009?