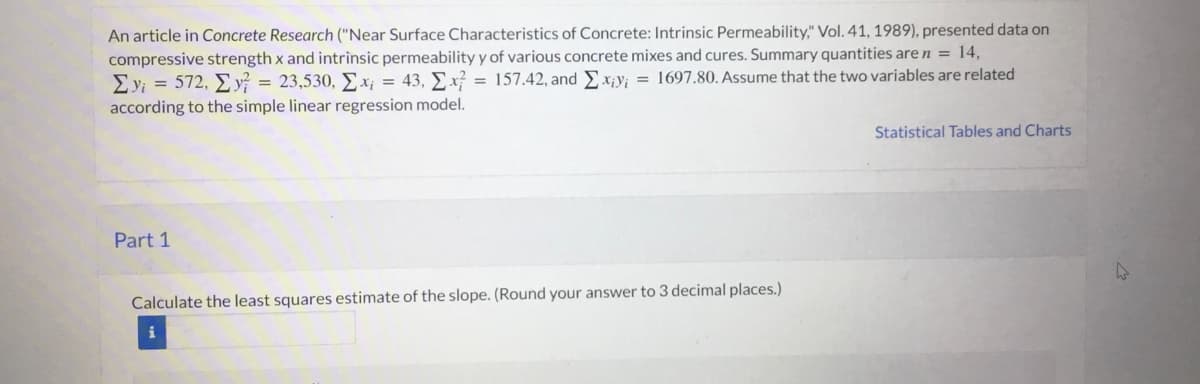
Calculate the least squares estimate of the slope. (Round your answer to 3 decimal places.)


Q: Which of the following statements stated below is precisely incorrect?
A: here given ,
Q: Questions: #1: What does this scatter plot look like? # 2: Describe what the graph is doing.
A: For the given data, we need to draw a scattered plot and describe it.
Q: average breaking strength is 50 kN, with a standard deviation of 2 kN. Find a 95% confidence…
A:
Q: A study of 420,035 cell phone users found that 0.0326% of them developed cancer of the brain or…
A: From the provided information, Sample size (n) = 420035 Sample proportion (p̂) = 0.000326 Confidence…
Q: Here is the description of the study again: In the study, 32 participants putted a golf ball to a 5-…
A: Here is the description of the study again: In the study, 32 participants putted a golf ball to a 5…
Q: Determine and from the given parameters of the population and sample size. H= 77, o =9, n= 81
A: Population mean (μ) = 77, population standard deviation (σ) = 9 and sample size (n) = 81 Then, We…
Q: (1) For a function f: R →R to be a probability density function it must satisify some conditions.…
A:
Q: Assume that the significance level is α=0.1. Use the given information to find the P-value and the…
A: From the above data We are given that the 3, the test statistic is z=−1.05. And also given that…
Q: 4. Which kind of study is generally more effective at blocking confounders?
A: Concept of confounding is important in statistical analysis.
Q: Given the information below, what kind of samples are being described? Sample 1: Final grade of 35…
A: Given that Given the information below, what kind of samples are being described? Sample 1: Final…
Q: Which of the following statements are true regarding the simple linear regression model y=β0+β1…
A: We have given given that, the simple linear regression modely=β0+β1 x1+ε1 Then, We have to check…
Q: The real age of a manuscript is known to be 1000 years old. Using scientific methods, an expert had…
A: Formulae: Absolute Error = |Actual Age- Estimated Age| Relative Error = Absolute error/Actual Age
Q: A company wants to evaluate its attrition rate, in other words, how long new hires stay with the…
A: we know that total probability is equal to…
Q: 1. Distribution of annual rainfall depth for a scale is matched as normal distribution. From sample,…
A: Given : Population Mean,μ = 80 Population Standard Deviation,σ = 10
Q: Construct a 90% confidence interval of the population proportion using the given information. x=…
A:
Q: A screening test with 99% specificity and 99% sensitivity will necessarily have higher predictive…
A: Sensitivity and Predictive value: When a test has high Sensitivity, it means that it is less…
Q: If a mass function is given by Ax x = 1, 2 ..., 50 P(x) A(100– x), x = 51, 52.., 100 otherwise (i)…
A:
Q: - Let X1,.. X is a random sample from Binomial(p1) and Y,.., Ym is another independent random sample…
A:
Q: a. Most of the live characters at an amusement park have height requirements with a minimum of 4 ft…
A: A survey found that women's heights are normally distributed with mean 63.1 in. and standard…
Q: Given that Z is a standard normal random variable, compute the following probabilities. a.…
A: Givena)P(-1≤Z≤0)
Q: Use the sample data with a 0.01 significance level to test the claim that for the population of ages…
A: Let ud is the mean value of the differences d for the population of all pairs of data, where each…
Q: use the frequency distribution to complete parts (d) through (e). a) Determine the total number…
A: The question is based on a frequency distribution Given :
Q: The random process X(t) is defined as follows: X(t) = A + e Bl) where A and B are independent random…
A:
Q: 12. Suppose a researcher is using a two-way Chi-square test to evaluate the relationship between…
A: For the given data df =?
Q: A hog raiser in a certain province uses two methods of pig-farming: intensive pig farming, where…
A: 1. The appropriate null and alternative hypotheses are :
Q: Assume that the mean weight of a 1-year-old infant is normally distributed with mean and standard…
A: Solution
Q: Q2. A random sample of 8 recent BBA graduates in a company was selected. The following table lists…
A: Hello! As you have posted more than 3 sub parts, we are answering the first 3 sub-parts. In case…
Q: Suppose that the average number of Facebook friends users have is normally distributed with a mean…
A:
Q: 14. In a First-Order (Straight-Line) Probabilistic Model y represents the _______ variable.…
A: We have given the following statement.
Q: We want to estimate the mean distance travelled to work by employees of a large manufacturing firm.…
A: Given,standard deviation(σ)=2margin of error(E)=0.1α=1-0.95=0.05α2=0.025Z0.025=1.96 (from Z-table)
Q: QUESTION 25 Which of the following statements stated below is precisely incorrect? OA For one tail…
A:
Q: Today, the waves are crashing onto the beach every 4.1 seconds. The times from when a person arrives…
A: Given,A random variable X~U(0, 4.1)f(x)=14.1 ; 0≤X≤4.1
Q: A marketing research firm tests the effectiveness of a new flavoring for a leading beverage using a…
A: Since you have posted a question with multiple sub-parts, we will solve first three subparts for…
Q: A Rayleigh density function is given by S(2) = *e* xe2 x20 f(x) x0 for all x and (b) Find the…
A:
Q: Suppose that you are to conduct the following hypothesis test for matched data: Ho: Hd H: Hd + 0 %3D…
A: Given data : sample size, n =21 sample mean,đ = 2.2 sample standard deviation,sd= 3.42…
Q: Find the critical value zα/2 that corresponds to α=0.08. Question content area bottom Part 1…
A: We have given that, Significance level (α) = 0.08 Then, We will find the Critical value (zα/2) =…
Q: You measure 33 dogs' weights, and find they have a mean weight of 58 ounces. Assume the population…
A: The random variable dog weight follows normal distribution. We have to find the maximal margin of…
Q: The shipment times in hours for a load of goods from a factory to market are tabulated in the…
A:
Q: Assume there is a certain population of fish in a pond whose growth is described by the logistic…
A: Given K=1400 r=210%
Q: Lifetimes of Wristwatches A random sample of the lifetimes of 29 inexpensive wristwatches has a…
A: From the provided information, Sample size (n) = 29 Sample standard deviation (s) = 4.8 Confidence…
Q: What is the variance of weight for men, if weight is re-expressed in kg? (1 lb = 0.453592 kg) %3D
A:
Q: 4 Suppose ô² = 200 and b = [3 5 2] where D(b,) = 28 D(b2) = 24 v(b3) = 18 %3D côv(b,,b2) = -16…
A: Consider the linear model y,Xb,σ2where b'=b1 b2 b3. Let σ^2=200 and b^'=3 5 2 where…
Q: B) In a sample of n = 50 people who recently received parking tickets, 36 were older than 25 years…
A: According to our policy, we can answer only first 3 part, for remaining please repost the question.
Q: The lifetime of a 2-volt non-rechargeable battery in constant use has a Normal distribution, with a…
A:
Q: Suppose a researcher used a sample of 400 students to determine if there is a significant preference…
A: It is given that the value of chi square is 4.32.
Q: In a clinical trial, 27 out of 845 patients taking a prescription drug daily complained of flulike…
A:
Q: At a carnival game, the chance of winning a prize is 0.45. Kylee plays the game 3 times. Using the…
A: Given that : X represent she wins the price. P(x) is probability of winning prize. By using basic…
Q: A researcher is interested in finding a 90% confidence interval for the mean number minutes students…
A: Given that, Point estimate = sample mean = = 39.1 sample standard deviation = s = 10.6 sample size…
Q: SNIC Insurance expected their health insurance loss ratio to be 69% for the current year. The actual…
A: Actual loss ratio = Losses and loss adjustment expenses / Premiums earned= $13,850,250 /…
Q: Ex. 2. A random variable X is exponentially distributed with the deviance 1/4. Compute the…
A:

Step by step
Solved in 2 steps

- The following fictitious table shows kryptonite price, in dollar per gram, t years after 2006. t= Years since 2006 0 1 2 3 4 5 6 7 8 9 10 K= Price 56 51 50 55 58 52 45 43 44 48 51 Make a quartic model of these data. Round the regression parameters to two decimal places.It is believed that the annual repair cost for the sporty automobile Jeep is related to its age. A sample of 11 automobiles revealed the results in the table at the right. Car age (xi) 2 3 1 7 5 8 1 2 6 9 4 Repair cost (yi) in £ 72 99 65 138 67 140 83 101 170 121 114 Define the terms regression and correlation analysis . From the simple linear model ,y= a + bx ,determine parameters a and bThe monthly premium quoted by an insurance company for a critical illness policy was collected from a sample of 6 adult male smokers at different age. The data for the sample are shown: Age 28 25 50 39 47 31 Premium ($) 75 40 175 125 250 105 Using Age to predict premium, the Linear Regression equation is given by: ŷ =6.556X−112 and r2=0.813y^=6.556X−112 and r2=0.813 a. Identify the independent and Dependent variables. Dependent: Age Premium Independent: Age Premium b. Determine the slope. Slope = Slope = Round to 3 decimal places c. Determine |r||r| . |r|=|r|= Round to 3 decimal places d. Interpret rr : and e. Determine critical r value at 5% significance level and determine if there is a significant linear correlation exists. |r| critical=|r| critical= Round to 3 decimal places Linear Correlation:Linear Correlation: Significant Not Significant f. Predict the monthly premium for a 40 years old adult male smoker.…
- The table contains data on vehicle speed (h) and fuel consumption (lt / 100km) of 5 randomly selected vehicles. Estimate the average fuel consumption of a vehicle traveling at 45 km / h using the simple linear regression equation between vehicle speed and fuel consumption. Speed 55 60 65 70 75 Consumption 11 10 9 8 7 Please choose one: a. 6 b. 5 c. 13 D. 8An auto manufacturing company wanted to investigate how the price of one of its car models depreciates with age. The research department at the company took a sample of eight cars of this model and collected the following information on the ages (in years) and prices (in hundreds of dollars) of these cars. Age 8 8 5 2 6 5 2 2 Price 38 19 53 70 40 51 80 80 1.) Find the least squares regression line equation in the form ^ = a+bx. y Use "Age" as the independent variable and "Price" as the dependent variable. 2.) Predict the price of a 5 year old car of this model. ypred=It is believed that the annual repair cost for the sporty automobile Jeep is related to its age. A sample of 11 automobiles revealed the results in the table at the right. Car age (xi) 2 3 1 7 5 8 1 2 6 9 4 Repair cost (yi) in £ 72 99 65 138 67 140 83 101 170 121 114 Define the terms regression and correlation analysis From the simple linear model , determine parameters and , with an interpretation of your linear model What would be the cost of repairing car that has been in use for 13 years
- The table contains data on vehicle speed (h) and fuel consumption (lt / 100km) of 5 randomly selected vehicles. Estimate the average fuel consumption of a vehicle traveling at 45 km / h using the simple linear regression equation between vehicle speed and fuel consumption. Speed 55 60 65 70 75 Consumption 13 12 11 10 9 a. 15 b. 8 c. 7 d. 20A sixth-grade teacher believes that there is a relationship between his students’ IQscores (y) and the numbers of hours (x) they spend watching television each week. Thefollowing table shows a random sample of 7 sixth-grade students.y 125 116 97 114 85 107 105x 5 10 30 16 41 28 21 Does the data provide sufficient evidence to indicate that the simple linear regressionmodel is appropriate to describe the relationship between x and y? Perform a model utilitytest at α = 0.05. (Give H0, Ha, rejection region, observed test statistic, P-value, decisionand conclusion.)Find the Pearson sample correlation coefficient between x and y. Then interpretthe result.King & Scott, a research firm for the real estate industry, studied the relation between x=x= annual income (in thousands of dollars) and y=y= sale price of house purchased (in thousands of dollars). A random sample of data was collected from mortgage applications for home sales in the region of the study, and is given in the table. Annual Income House Price 72 188 48 91.6 73 182.2 97 155.5 97 238.8 94 203.4 67 160.1 85 212 64 169 Conduct a linear regression. Use the results to answer the following questions. a. What is the value of the correlation coefficient (round to 3 decimal places)? What does the value tell you about the linear relationship between the annual income and the price of house purchased? Correlation coefficient: This indicates: very weak positive linear correlation fairly strong negative linear correlation perfect positive linear correlation very weak negative linear correlation perfect negative linear correlation no linear…
- A random sample of twelve students were chosen, and their midterm test score (y), as- signment score (x1), and missed classes (x2) were recorded as follows: Midterm Score, y Assignment Score, x1 Classes Missed, x2 85 74 76 90 85 87 94 98 81 91 76 74 65 50 55 65 55 70 65 70 55 70 50 55 5 7 5 2 6 3 2 5 4 3 1 4 (i) What is the fitted multiple linear regression equation of the form yˆ = b0 + b1x1 + b2x2? (ii) From part (i) above, estimate the midterm test score grade for a student who has an assignment score of 60 and missed 4 classes.The following data is representative of that reported in an article on nitrogen emissions, with x = burner area liberation rate (MBtu/hr-ft2) and y = NOx emission rate (ppm): x 100 125 125 150 150 200 200 250 250 300 300 350 400 400 y 160 140 190 210 200 320 280 400 440 430 400 600 600 660 (a) Assuming that the simple linear regression model is valid, obtain the least squares estimate of the true regression line. (Round all numerical values to four decimal places.)y = (b) What is the estimate of expected NOx emission rate when burner area liberation rate equals 240? (Round your answer to two decimal places.)ppm(c) Estimate the amount by which you expect NOx emission rate to change when burner area liberation rate is decreased by 60. (Round your answer to two decimal places.)ppm(d) Would you use the estimated regression line to predict emission rate for a liberation rate of 500? Why or why not? Yes, the data is perfectly linear, thus lending to accurate predictions.…The number of initial public offerings of stock issued in a 10-year period and the total proceeds of these offerings(in millions) are shown in the table. The equation of the regression line is y=47.538x+18,727.65. Complete parts a and b. Issues, x Proceeds, y 423 18,632 460 27,913 687 44,071 485 32,435 500 66,634 389 66,734 57 22,180 65 11,296 188 31,929 163 27,891 (a) Find the coefficient of determination and interpret the result. How can the coefficient of determination be interpreted? (b) Find the standard error of estimate se and interpret the result. How can the standard error of estimate be interpreted?
