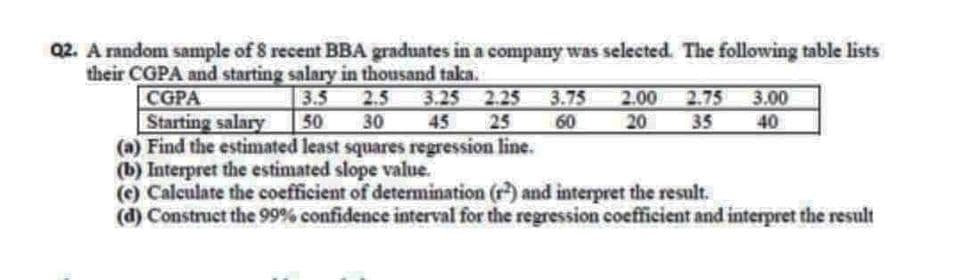
Q2. A random sample of 8 recent BBA graduates in a company was selected. The following table lists their CGPA and starting salary in thousand taka. 3.5 50 CGPA 2.5 3.25 2.25 3.75 60 2.00 2.75 3.00 Starting salary 30 45 25 Pon line 20 35 40 timated leat sonara


Q: What is the value of the test statistic for this problem
A: here given The ages of undergraduate students at two universities (one in the east and one in the…
Q: Perform correlation analysis. How strong is the linear relationship between Y and X?
A: Given information: y x x^2 y^2 xy 73 100 10000 5329 7300 68 118 13924 4624 8024 91 141…
Q: Two different methods can be used for measuring the temperature of the solution of a Hall cell used…
A: The independent variable is Thermo couple. The dependent variable is IR. We have do regression…
Q: Perform the following hypothesis test: HO: µ = 6 H1: µ 6 The sample mean is 5.8, sample standard…
A:
Q: ominic would want to estimate the mean of a population which is normally distributed. The standard…
A:
Q: 15. Show that the formula for mean deviation from the mean can be written in the form 2 M.D. - Σi-Σ…
A:
Q: For a cooking oil company, the price they are paid for coconuts in large shipments is based on the…
A:
Q: You wish to test the following claim (HaHa) at a significance level of α=0.05 Ho:μ=85.9…
A: We have given that, Population mean (μ) = 85.9, population standard deviation (σ) = 9.1, sample…
Q: the mean and standard deviation of the body mass index (BMI) for a sample of 10,215 women who drink…
A:
Q: State the null and alternative hypothesis (in symbol) for the given situtation. The variability of…
A:
Q: Let the Income Performance of State Uriversities and Colleges be the dependent variable. Let the…
A: Solution: The regression output is given.
Q: In a shudy, researchere wanted to measure the effect of alcohol on the hippocampal region, the…
A: Given in step 2 is the answer
Q: ICLO-11 The following question refers to a country with four states. There are 100 seats in the…
A:
Q: (e) Is there evidence of a nonlinear relationship between birth weight and mother's weight gain?
A: Level of significance α = 0.05 (Consider) Given that, Variable: Birth weight (MOM_AGE_CNTRD) The…
Q: Q, Determine the PDF for multiple RV Y (a) Y, = X,tXz+ X3 Con dition Xi,Xz, X3 are wni formly…
A: Let us consider Irwin-Hall distribution as follows: Let X1, X2, ...., Xn be a random sample of size…
Q: According to lIn-n-Out's own web site a Double-Double has 18 g of saturated fat. Assume the grams of…
A: Given that ; μ=18 g ? = 5 g By using the central limit theorem we solve this problem.
Q: Setup: A research laboratory was developing a new compound for the relief of severe cases of hay…
A: Given information:
Q: Data on the numbers of hospital admissions resulting from motor vehicle crashes are given below for…
A: Note: If the post contains multiple questions only allow to do first question as per guidelines of…
Q: Suppose F(x, y) = (2y, - sin(y)) and C is the circle of radius 6 centered at the origin oriented %3D…
A:
Q: With 95% confidence the population mean minutes of concentration is between (round to 3 decimal…
A:
Q: h Formula A Formula B Formula C .500000 5.764e-01 6.670e-02 9.329e-03 .250000 3.096e-01 1.683e-02…
A:
Q: Calibrating a scale: Making sure that the scales used by businesses in the United States are…
A: The random variable calibration point follows normal distribution. We have to test whether the…
Q: What is the standard error estimate State H0 and H1 What’s the p value Did you reject H0
A:
Q: #6 If n = 320 and X = 256, construct a 90% confidence interval for the population proportion, p.…
A: Given: n = 320 X = 256 Confidence level = 0.90 α=1-0.90=0.10
Q: Is the average time to complete an obstacle course different when a patch is placed over the right…
A: Hi! Thank you for the question, As per the honor code, we are allowed to answer three sub-parts at a…
Q: Perform the following hypothesis test of a proportion: HO: p = 0.125 HA: p 0.125 The sample…
A: We have given that, Population proportion (p) = 0.125, sample proportion (p̂) = 0.1, sample size…
Q: e population of a city is made up of 2223 men and 7777 women. For an opinion survey, a STRATIFIED…
A: We know that the In the stratified sampling method, the sample is drawn on the basis of proportion…
Q: Suppose Y is a random variable with E(Y) = 13 and Var(Y) = 6. Solve for the following: (show…
A: Given information: E(Y)=13 and Var(Y)=6 a E(3Y+10)=3E(Y)+10=(3*13)+6=45 b.…
Q: Assume that a sample is used to estimate a population proportion p. Find the 99% confidence interval…
A: We have given that, Sample size (n) = 143 and sample proportion (p) = 65% = 0.65 Then, We will…
Q: The US Department of Energy reported that 46% of homes were heated by natural gas. A random sample…
A:
Q: Theorem. If there are r series of observations X1, X2, ... X, then the mean M of the whole series is…
A:
Q: X= 80.895682 68.317985 3.4019315 23.805456 94.920116 21.827886 61.546878…
A: The first order of moment around the mean is nothing but the mean itself. The second and third-order…
Q: The amount of time it takes students to travel to school can vary greatly depending on how far a…
A:
Q: A Gaussian random variable X with u, = 4 and o=3 is generated. Find the probability of X <775, Write…
A:
Q: Consider a fictitious country Makria with four states Urbinulla, Konta, Cyclos, and Pantou. The…
A: We know that, standard divisor= total population/no. of seats =(12521+3879+8764+4836)/28 = 1071.42…
Q: It takes an average of 9.9 minutes for blood to begin clotting after an injury. An EMT wants to see…
A: The level of significance is 0.01.
Q: You want to obtain a sample to estimate a population proportion. Based on previous evidence, you…
A: Confidence interval is an interval such that the probability of the unknown parameter to be included…
Q: Today, the waves are crashing onto the beach every 4.1 seconds. The times from when a person arrives…
A:
Q: A nationwide test taken by high school sophomores and juniors has three sections, each scored on a…
A: From the provided information, Mean (µ) = 49.6 Standard deviation (σ) = 9.8
Q: Today, the waves are crashing onto the beach every 4.1 seconds. The times from when a person arrives…
A: As per guideline expert have to answer first question three subparts only dear student please upload…
Q: Given in the table are the BMI statistics for random samples of men and women. Assume that the two…
A: Since there are 2 different questions, I solved 1st problem as per Bartleby rules. Please post the…
Q: Ch.8 Proportions #1 In a survey of 471 randomly selected gun owners, it was found that 85 of them…
A: We have given that, Favorable cases (X) = 85 and sample size (n) = 471 Then, We will find the 95%…
Q: he following histogram represents the number of pages in each book within a collection. What is the…
A: 1) The histogram represents the number of pages in each book within a collection.
Q: The relationship between marketing expenditures (x) and sales (y) is given by the following formula,…
A: Please see below
Q: A study was done using a treatment group and a placebo group. The results are shown in the table.…
A:
Q: What is likely true about the distribution of YouTube views to have such different results when…
A: A careful inspection of the table reveal that the percentile value increases for each percentile.…
Q: 4. Following are boxplots of weekly sales for a food store chain's three similar size and location…
A: From two box plot, We have to answer for mentioned questions by comparing both box plots.
Q: ch.8 question #12 Express the confidence interval 0.837±0.033 in open interval form (i.e.,…
A: We have given that, Confidence interval (C.I) = 0.837±0.033 Then, We will express above confidence…
Q: A +Y. (ii) Let X and Y be independent poisson random variables with respective parameters A and A…
A:
Q: 34. A bag contains six balls of different colours and a ball is drawn from it. A speaks truth twice…
A:

Step by step
Solved in 2 steps with 1 images

- Calculate the R2of the following multivariate sample regression functions and interpret theanswers.3.1 Investment-hat = β1-hat + β2-hat*Interest rate + β3-hat*Exchange rateESS = 900RSS = 1003.2 Investment-hat = β1 + β2-hat*Interest rate + β3-hat*number of 311 studentsESS = 400RSS = 6003.3 Salary-hat = β1 + β2-hat*Frequency of blinking eyes + β3-hat*Colour of hairRSS = 950TSS = 1000Years of Work Experience and number of Job Offers of 10 job-seekers were as follows: Work Exp. 4 2 5 3 7 12 2 5 4 9 No. of Offers 7 1 8 4 13 19 3 11 9 15 a. Fit the regression equation of No. of Job Offers on Years of Work Experience. b. What will be the predicted number of offers for an applicant with 6 years of experience? c. Verify the relationship between the number of job offers and years of work experience using at least two relevant methodsA set of n = 15 pairs of X and Y values has a correlation of r = +0.80 with SSY = 75, and the regression equation for predicting Y is computed. Find the standard error of estimate for the regression equation. How big would the standard error be if the sample size were n = 30.
- 1. Prior to being hired, the ve salespersons for a computer store were given a standard sales aptitude test. For each individual, the score achieved on the aptitude test and the number of computer systems sold during the first 3 months of their employment are shown in the attached image. (a) Determine the least-squares regression line and interpret its slope. (b) Estimate, for a new employee who scores 60 on the sales aptitude test, the number of units the new employee will sell in her first 3 months with the company. (c) Find the standard error of estimate. (d) Find the r-square of the model.A researcher collected data on the cholesterol level, CC, and the age, AA, of 24 people selected at random. Using the data, the researcher calculated the least-squares regression line to be Cˆ=182+2.2AC^=182+2.2A and the standard error of the slope to be 0.38. If the conditions for inference are met, which of the following is closest to the value of the test statistic to test the hypotheses H0:β=0H0:β=0 versus Ha:β≠0Ha:β≠0 ?For a sample of 8 employees, a personnel director has collected the following data on ownership of company stock, y, versus years with the firm, x. X 6 12 14 6 9 13 15 9 Y 300 408 560 252 288 650 630 522 (a) Determine the least-squares regression line and interpret its slope(b) For an employee who has been with the firm 10 years, what is the predicted number of shares owned? (c) Is there a statistical significance between years of service and ownership of company stocks? (use α=0.05α=0.05)
- The data regarding the production of wheat in tons (X) and the price of the kilo of flour in Ghana cedis (Y) Takoradi some years ago were: a. Fit the regression line for the day using the method of least squaresThe marketing manager of a supermarket chain would like to determine the effect of shelf spaceon the sales of pet food. A random sample of 10 stores was selected, and the results are presentedbelow. Store shelf space in cm weekly sales in thousand pesos 1 45 18 2 45 21 3 75 15 4 80 18 5 95 23 6 100 26 7 135 22 8 140 27 9 185 25 10 190 28 d. Using the estimated simple linear regression equation Y=15.6414+0.0611X, estimate the weekly sales when theshelf space is 230cm? 250cm? e. Compute the coefficient of determination and interpret its value.A company trains its employees with instructional videos and claims that the amount of time, in hours, spent training is linearly related to an increase in productivity. The company selected a random sample of five employees to test its claim. The data were used to create the computer output for a least-squares linear regression, shown in the table. Variable DF Estimate SE Intercept 1 3.6 1.1489 Hours 1 0.8 0.3464 Which of the following is the correct test statistic and number of degrees of freedom? t=2.31 with 4 degrees of freedom A t=2.31 with 3 degrees of freedom B t=2.31 with 5 degrees of freedom C t=3.13 with 1 degree of freedom D t=3.13 with 3 degrees of freedom E
- Mr. James, president of Daniel-James Financial Services, believes that there is a relationship between the number of client contacts and the dollar amount of sales. To document this assertion, he gathered the following information from a sample of clients for the last month. Let X represent the number of times that the client was contacted and Y represent the valye of sales ($1000) for each client sampled. Number of Contacts (X) Sales ($1000) 14 24 12 14 20 28 16 30 23 30 a) Compute the regression equation for client contacts and sales. Interpret the slope and intercept parameters.Given are five observations for two variables, x and y. xi 3 8 12 18 20 yi 54 57 50 24 11 -select your answer choices- b. The least squares line provided an (good, bad) fit; __ % of the variability in y has been explained by the estimated regression equation (to 1 decimal)The following table presents the percentage of students who tested proficient in reading and the percentage who tested proficient in math for 5 randomly selected states in the United States. Compute the least-squares regression line for predicting math proficiency from reading proficiency. State Percent Proficientin Reading Percent Proficientin Mathematics Illinois 75 70 North Carolina 71 73 California 60 59 Georgia 67 64 Florida 66 68 Send data to Excel The equation for the least squares regression line is y = . Round the slope and y -intercept to four decimal places as needed.