Calculate the total revenue if the firm produces 4 versus 3 units. Then, calculate the marginal revenue of the fourth unit produced. The marginal revenue of the fourth unit produced is________. Calculate the total revenue if the firm produces 8 versus 7 units. Then, calculate the marginal revenue of the eighth unit produced. The marginal revenue of the eighth unit produced is________.
Calculate the total revenue if the firm produces 4 versus 3 units. Then, calculate the marginal revenue of the fourth unit produced. The marginal revenue of the fourth unit produced is________. Calculate the total revenue if the firm produces 8 versus 7 units. Then, calculate the marginal revenue of the eighth unit produced. The marginal revenue of the eighth unit produced is________.

Chapter1: Making Economics Decisions
Section: Chapter Questions
Problem 1QTC

Related questions
Question
100%
Calculate the total revenue if the firm produces 4 versus 3 units. Then, calculate the marginal revenue of the fourth unit produced.
The marginal revenue of the fourth unit produced is________.
Calculate the total revenue if the firm produces 8 versus 7 units. Then, calculate the marginal revenue of the eighth unit produced.
The marginal revenue of the eighth unit produced is________.
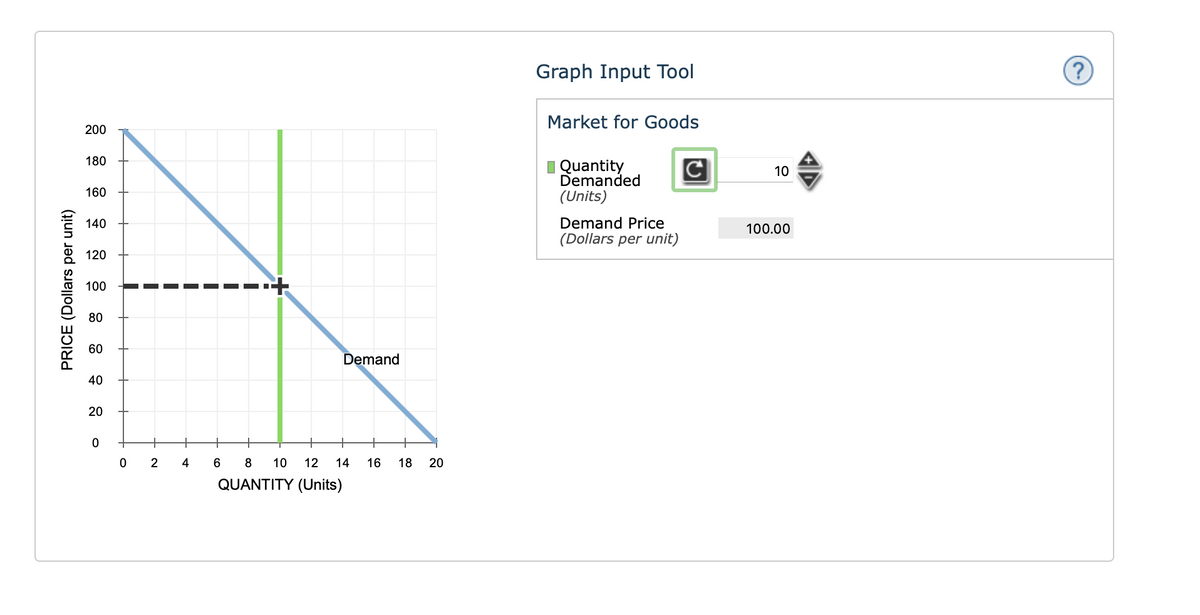
Transcribed Image Text:Graph Input Tool
Market for Goods
200
180
I Quantity
Demanded
(Units)
10
160
Demand Price
(Dollars per unit)
140
100.00
120
100
80
60
Demand
40
20
+
0 2
4
6
8
10
12
14
16
18
20
QUANTITY (Units)
PRICE (Dollars per unit)
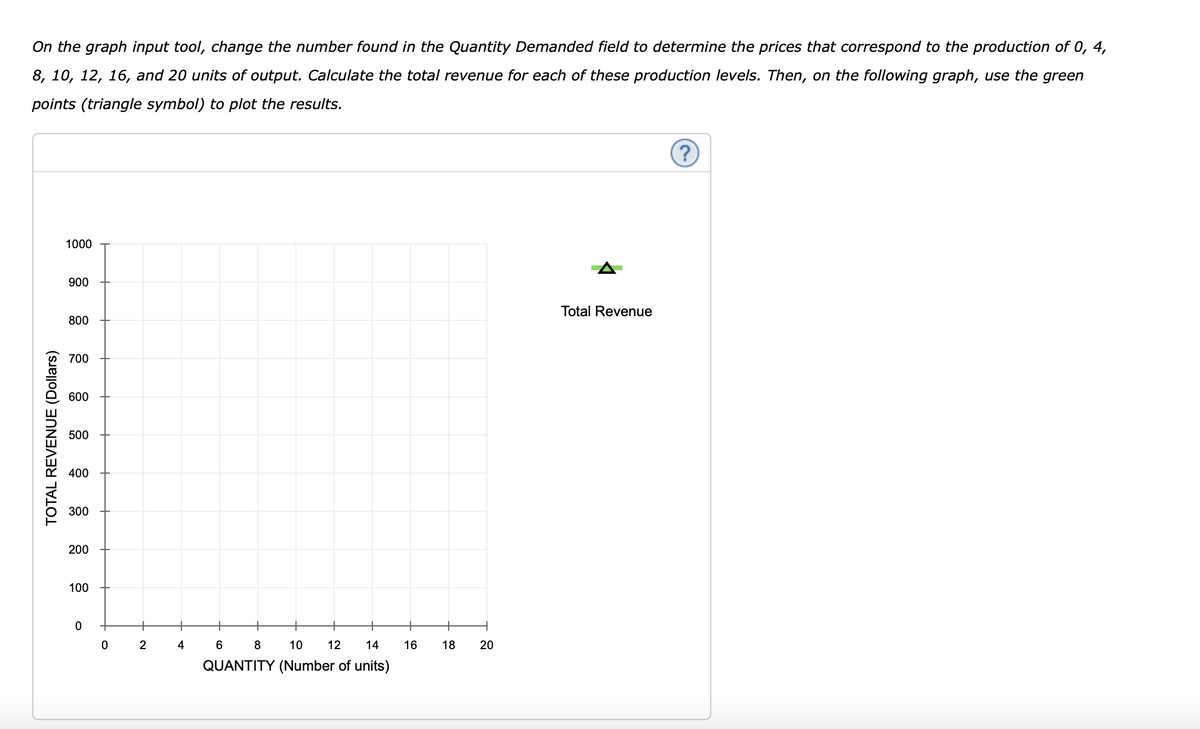
Transcribed Image Text:On the graph input tool, change the number found in the Quantity Demanded field to determine the prices that correspond to the production of 0, 4,
8, 10, 12, 16, and 20 units of output. Calculate the total revenue for each of these production levels. Then, on the following graph, use the green
points (triangle symbol) to plot the results.
1000
900
Total Revenue
800
700
600
500
400
300
200
100
2
4
6
10
12
14
16
18
QUANTITY (Number of units)
TOTAL REVENUE (Dollars)
20
Expert Solution
This question has been solved!
Explore an expertly crafted, step-by-step solution for a thorough understanding of key concepts.

This is a popular solution!

Trending now
This is a popular solution!

Step by step
Solved in 2 steps with 1 images

Knowledge Booster


Learn more about
Need a deep-dive on the concept behind this application? Look no further. Learn more about this topic, economics and related others by exploring similar questions and additional content below.Recommended textbooks for you

Principles of Economics (12th Edition)
Economics
ISBN:
9780134078779
Author:
Karl E. Case, Ray C. Fair, Sharon E. Oster
Publisher:
PEARSON

Engineering Economy (17th Edition)
Economics
ISBN:
9780134870069
Author:
William G. Sullivan, Elin M. Wicks, C. Patrick Koelling
Publisher:
PEARSON
Principles of Economics (12th Edition)
Economics
ISBN:
9780134078779
Author:
Karl E. Case, Ray C. Fair, Sharon E. Oster
Publisher:
PEARSON
Engineering Economy (17th Edition)
Economics
ISBN:
9780134870069
Author:
William G. Sullivan, Elin M. Wicks, C. Patrick Koelling
Publisher:
PEARSON

Principles of Economics (MindTap Course List)
Economics
ISBN:
9781305585126
Author:
N. Gregory Mankiw
Publisher:
Cengage Learning

Managerial Economics: A Problem Solving Approach
Economics
ISBN:
9781337106665
Author:
Luke M. Froeb, Brian T. McCann, Michael R. Ward, Mike Shor
Publisher:
Cengage Learning

Managerial Economics & Business Strategy (Mcgraw-…
Economics
ISBN:
9781259290619
Author:
Michael Baye, Jeff Prince
Publisher:
McGraw-Hill Education