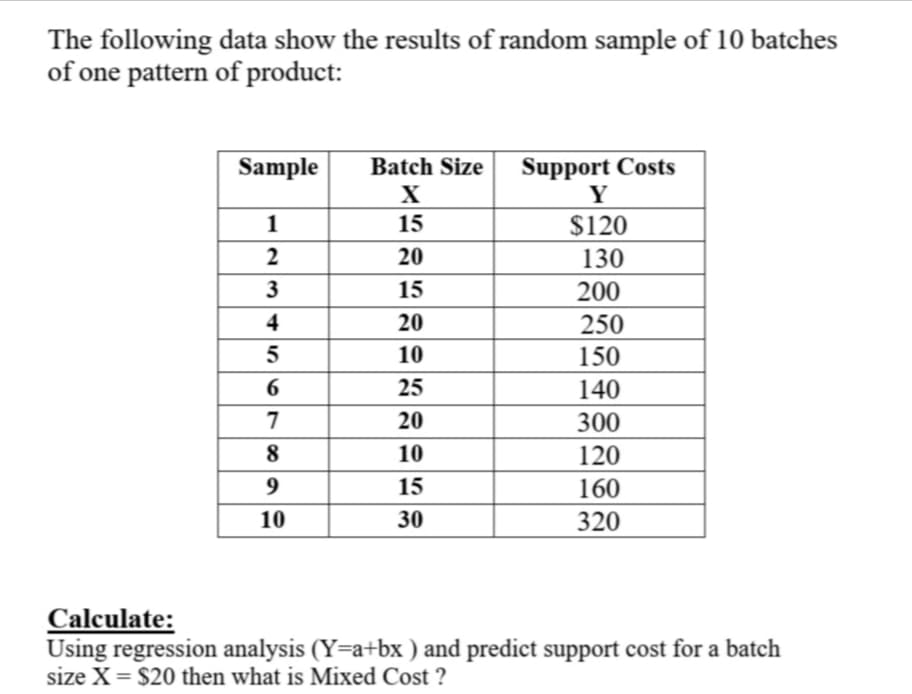
Calculate: Using regression analysis (Y=a+bx ) and predict support cost for a batch size X = $20 then what is Mixed Cost ?


Q: How do you determine whether a regression model is showing a case of redundancy?
A: Multicollinearity is simply redundancy in the information contained in predictor variables. If the…
Q: What is the equation of multiple linear regression?
A: Multiple linear regression is a statistical technique used to predict outcome of a variable based on…
Q: What is not motivation for running multiple linear regression?
A: Multiple linear regression model (MLRM) estimates the statistical relationship between a dependent…
Q: Another bowl In Exercise 1, the regression modelPotassium = 38 + 27 Fiber relates fiber (in grams)…
A: In an analysis of the amount of fiber (in grams) and the potassium content (in milligrams) in…
Q: À financial analyst builds a regression model to predict the cost of a project based upon several…
A: The given regression output is,
Q: Your colleague investigates how prices of coffee vary with temperature. He wants to estimate the…
A: If the variable temp is measured in Fahrenheit and the same variable temp is measured in Celsius,…
Q: For Exercise, use the scatter plot to determine if a linear regression model appears to be…
A: Scatter Plot Diagrams: If data is given in pairs then the scatter plot diagram of the data is just…
Q: How do you determine if a regression model is showing a case of suppression?
A: Suppressions: It can be defined as “a variable which increases the predictive validity of another…
Q: i. Determine the regression equation. (5) ii. Estimate sales when 3 million is spent on advertising…
A: Hi! Thank you for the question, As per the honor code, we are allowed to answer one question at a…
Q: Calculate the simple linear regression to determine if the amount of sleep (y) can be predicted by…
A: The following data for the X and Y variables are given for linear regression model: X = Homework…
Q: Based on the regression model, what is the best estimate of paint sales (x 1,000 gallons) in a sales…
A: Given:
Q: 4) Use the regression equation to predict the price of a 2000 square foot house in North Salinas.
A: From the question 4: It is required to obtain the predicted value of the price of a 2000 square foot…
Q: Explain the concept of Slopes and Elasticities for Nonlinear Regression Functions?
A: From the given information, Consider, nonlinear regression function is- Y = ALα Kβ Now, slope and…
Q: A regression analyzes between demand (y in kilogram) and supply( X in kilogram) resulted in the…
A:
Q: To estimate the regression equation, the slope is equal to?
A: Here given paired data of x and y By using formula of regression line slope
Q: The R2 statistic can decrease when a new regressor variable is added to a multiple linear regression…
A: Regression analysis is very significant in data analysis. When data points are given, there are…
Q: Explain the first step in the written development of a regression model?
A: Regression model: Regression analysis is used to study the relationship between two or more…
Q: What are the three requirements of linear regression?
A: these are the following three requirement of linear regression
Q: What is the concept of linear regression? Can linear regression be automatically calculated in SPSS?
A: Explanation.... concept of linear regression
Q: 18. Explain the general principle used to train linear regression models.
A: The linear regression model has a set of values in a variable x. For each corresponding value of x…
Q: i. Calculate the regression model to fit the data. ii. Predict the life time of the device for the…
A: Given that, Company XYZ manufactures an electronic device to be used in a very wide temperature…
Q: Write the multiple regression equation for miles per gallon as the response variable. Use weight and…
A: A regression equation models the dependent relationship of two or more variables. It is a measure of…
Q: (a) Demonstrate the two important things that should be done before one performs regression…
A: Regression analysis examines the relationship between one or more variables. So two things that can…
Q: What is the flowchart of non linear regression? explain.
A:
Q: What are the functional forms of the regression model? Explain.
A: A functional form refers to the algebraic form of a relationship between a dependent variable and…
Q: Define the different ways to use linear regression?
A: Type of regressions is given below: Simple linear regression model Multiple linear regression…
Q: Use linear regression to find the equation for the linear function that best fits this data. Round…
A:
Q: Explain what a dummy variable is and how it is used in regression analysis
A:
Q: In a study of housing demand, the county assessor develops the following regression model to…
A: The slope coefficient of X1 (measured in 100 feets) is 3.459. So, holding all else constant, an…
Q: What is the independent variable using the table below showing the regression of assets and revenue?
A: Independent variable: The variable which does not influenced by other variables then it is called as…
Q: Find the regression model.
A: We have used the excel data analysis tool to run the regression analysis.
Q: Define the assumptions of multiple regression and specify which aspects of the analysis require…
A: Note: Hey there! Thank you for the question. We have stated the assumptions for you. We have…
Q: Explain the standard error of the regression?
A:
Q: Expalin the concept of Nonlinear Regression Functions in detail?
A: Nonlinear function: Nonlinear regression is a form of regression analysis is defined as fit to a…
Q: What is R2 for this regression analysis and what does it mean? .For the equation Y = bX + a, in the…
A: We have to determine the R2, line of regression and significance of the relationship based on given…
Q: 6. Interpret the slope of the regression line in context .
A: Given data in question table Coefficient of Slope line =0.2838
Q: Find the residual sum of squares of the regression model
A:
Q: Define linear regression?
A:
Q: Explain a General Approach to Modeling Nonlinearities Using Multiple Regression?
A: Regression: The functional relationship of dependent variable with one or more independent variables…
Q: When fitting a linear regression, multiple regression lines may be equally as good to represent the…
A: Linear regression is used for forecasting and predictions in statistics.
Q: Based on this data, fit a linear regression model and predict the total number of baskets that will…
A: Let Y be the number of baskets in a season and X be the amount of salary. Given that mean = 1.1 and…
Q: Describe in detail about regression lines?
A:
Q: Illustrate the importance of using regression models.
A: What is Regression Analysis ? Regression analysis is a method of mathematically sorting out which…
Q: 3) Use the regression equation to predict the price of a 2000 square foot house in South Salinas.
A: From the above question 3 3) Use the regression equation to predict the price of a 2000 square…
Q: Develop the estimated regression equation that could be used to predict the percentage of games won…
A: In this case Yards/Attempt (x) is the independent variable and WinPct (y) is the dependent variable.…
Q: Write the simple linear regression equation for miles per gallon as the response variable and weight…
A: For dependent random variable y and the independent random variable x, the simple linear regression…
Q: True or False Having a linear regression equation allows us to predict a Y' score for any X value?
A: The linear regression equation allows us to predict Y' score for the given range of X values only.…
Q: Explain the roles of tenter and tremove in stepwise regression.
A: Stepwise regression method:Stepwise regression method is a combination of forward selection method…

Correlation
Correlation defines a relationship between two independent variables. It tells the degree to which variables move in relation to each other. When two sets of data are related to each other, there is a correlation between them.
Linear Correlation
A correlation is used to determine the relationships between numerical and categorical variables. In other words, it is an indicator of how things are connected to one another. The correlation analysis is the study of how variables are related.
Regression Analysis
Regression analysis is a statistical method in which it estimates the relationship between a dependent variable and one or more independent variable. In simple terms dependent variable is called as outcome variable and independent variable is called as predictors. Regression analysis is one of the methods to find the trends in data. The independent variable used in Regression analysis is named Predictor variable. It offers data of an associated dependent variable regarding a particular outcome.

Step by step
Solved in 2 steps with 7 images


- The Update to the Task Force Report on Blood Pressure Control in Children [12] reported the observed 90th per-centile of SBP in single years of age from age 1 to 17 based on prior studies. The data for boys of average height are given in Table 11.18. Suppose we seek a more efficient way to display the data and choose linear regression to accomplish this task. age sbp 1 99 2 102 3 105 4 107 5 108 6 110 7 111 8 112 9 114 10 115 11 117 12 120 13 122 14 125 15 127 16 130 17 132 Do you think the linear regression provides a good fit to the data? Why or why not? Use residual analysis to justify your answer. Am I supposed to run a residual plot and QQ-plot for this question?A researcher would like to predict the dependent variable Y from the two independent variables X1 and X2 for a sample of N=10 subjects. Use multiple linear regression to calculate the coefficient of multiple determination and test statistics to assess the significance of the regression model and partial slopes. Use a significance level α=0.05. X1 X2 Y 31.9 50.2 89.2 12.7 25.5 33.5 41.2 46.4 44.5 29.2 42.9 76.3 22.9 36.6 56 39.4 46.6 55.3 36.4 46.2 43 56.1 49.6 7.6 21 39.7 58.2 58 48.3 22.6 R2=F= P-value for overall model = t1= for b1, P-value = t2= for b2, P-value = What is your conclusion for the overall regression model (also called the omnibus test)? The overall regression model is statistically significant at α=0.05. The overall regression model is not statistically significant at α=0.05. Which of the regression coefficients are statistically different from zero? neither regression coefficient is statistically significant the slope for the first…A research department of an American automobile company wants to develop a model topredict gasoline mileage (measured in MPG) of the company’s vehicles by using theirhorsepower and weights (measured in pounds). To do this, it took a random sample of 50vehicles to perform a regression analysis as follows: SUMMARYOUTPUTRegression StatisticsMultiple R 0.865689R Square 0.749417Adjusted RSquare 0.738754Standard Error 4.176602Observations 50ANOVAdf SS MS FRegression a 2451.973702 1225.987 dResidual b 819.8680976 cTotal 49 3271.8418CoefficientsStandardError t StatIntercept 58.15708 2.658248208 21.87797Horsepower -0.11753 0.032643428 -3.60028Weight -0.00687 0.001401173 -4.90349(a) State the multiple regression equation. Interpret the meanings of the coefficients forhorsepower and weight.(b) Test the validity of this multiple regression equation at the significance level of 1%. Showyour reasoning.(c) The research department claims that the weight of the vehicle is negatively linearly related…
- Mr. James, president of Daniel-James Financial Services, believes that there is a relationship between the number of client contacts and the dollar amount of sales. To document this assertion, he gathered the following information from a sample of clients for the last month. Let X represent the number of times that the client was contacted and Y represent the valye of sales ($1000) for each client sampled. Number of Contacts (X) Sales ($1000) 14 24 12 14 20 28 16 30 23 30 a) Compute the regression equation for client contacts and sales. Interpret the slope and intercept parameters.The following data has mid term marks and end term marks of 9 students. Maximum marks for both mid term marks as well as end term marks is 100. Calculate regression line between mid term marks (independent) and end term marks (Dependent) using below dataset. Give detailed explanation with solution. Student Roll No. 1 2 3 4 5 6 7 8 9 Mid Term Marks 67 59 73 63 89 78 64 28 89 End Term Marks 55 42 80 83 76 67 63 33 58A researcher would like to predict the dependent variable YY from the two independent variables X1 and X2 for a sample of N=13 subjects. Use multiple linear regression to calculate the coefficient of multiple determination and test statistics to assess the significance of the regression model and partial slopes. Use a significance level α=0.01. X1 X2 Y 38.3 52.7 55.5 50.9 76 89.3 33.5 57.6 18.6 40.9 43.6 27.7 48.7 63.5 76.5 49.6 73.3 57.4 36.9 53.3 29.8 35.4 62.8 50.2 39 76.3 65.4 64.9 57.7 71.5 54.8 58 51.5 37.8 62.6 54.7 56.7 50.5 36.6 R2=F= P-value for overall model = t1=for b1, P-value = t2= for b2, P-value =
- A random sample of eight drivers selected from a small town insured with a company and having similar minimum required auto insurance policies was selected. The following table lists their driving experiences in years and monthly auto insurance premiums in dollars. Driving Experience: 5 2 12 9 15 6 25 16 Monthly Premium in $: 64 87 50 71 44 56 42 60 We are creating a regression model (line) to predict premium amount using driving experience. A. Identify the Dependent and Independent variables. B. Using Excel, create a regression output page. Attach the output page. C. Complete the regression line. D. Evaluate and explain the strength of the relationship. E. How good is the model according to the Coefficient of Determination? F. Predict the premium when the driving experience is 8 years. G. Predict the premium when the driving experience is 18 years.Suppose that researchers obtain a random sample of adults ages 18 – 40 and collect data on the following variables: shoe size – in inches age – in years height – in inches forearm length – in inches Suppose further that a multiple linear regression model is fit to the resulting data set using R Studio and that the following output is obtained from it. Use this output to answer the question that follows: > summary(lm(shoesize ~ age + height + forearm, data = measures)) Coefficients: (Intercept)ageheightforearm Estimate10.14882 0.06045 -0.02108 -0.06479 Std. Error 4.49245 0.06838 0.06350 0.06847 t value2.259 0.884 -0.332 -0.946 Pr(>|t|) 0.0264 0.3792 0.7408 0.3467 Residual standard error: 1.719 on 85 degrees of freedomMultiple R-squared: 0.01983, Adjusted R-squared: 0.01477 F-statistic: 0.5731 on 3 and 85 DF, p-value: 0.6342 Which of the following is the correct interpretation of the Adjusted R-squared? The probability that our model…Suppose that researchers obtain a random sample of adults ages 18 – 40 and collect data on the following variables: shoe size – in inches age – in years height – in inches forearm length – in inches Suppose further that a multiple linear regression model is fit to the resulting data set using R Studio and that the following output is obtained from it. Use this output to answer the question that follows: > summary(lm(shoesize ~ age + height + forearm, data = measures)) Coefficients: (Intercept)ageheightforearm Estimate10.14882 0.06045 -0.02108 -0.06479 Std. Error 4.49245 0.06838 0.06350 0.06847 t value2.259 0.884 -0.332 -0.946 Pr(>|t|) 0.0264 0.3792 0.7408 0.3467 Residual standard error: 1.719 on 85 degrees of freedomMultiple R-squared: 0.01983, Adjusted R-squared: 0.01477 F-statistic: 0.5731 on 3 and 85 DF, p-value: 0.6342 What is the estimate for the standard deviation of the residuals? 1.719 0.01983 -0.946 0.6342
- Suppose that researchers obtain a random sample of adults ages 18 – 40 and collect data on the following variables: shoe size – in inches age – in years height – in inches forearm length – in inches Suppose further that a multiple linear regression model is fit to the resulting data set using R Studio and that the following output is obtained from it. Use this output to answer the question that follows: > summary(lm(shoesize ~ age + height + forearm, data = measures)) Coefficients: (Intercept)ageheightforearm Estimate10.14882 0.06045 -0.02108 -0.06479 Std. Error 4.49245 0.06838 0.06350 0.06847 t value2.259 0.884 -0.332 -0.946 Pr(>|t|) 0.0264 0.3792 0.7408 0.3467 Residual standard error: 1.719 on 85 degrees of freedomMultiple R-squared: 0.01983, Adjusted R-squared: -0.01477 F-statistic: 0.5731 on 3 and 85 DF, p-value: 0.6342 Which of the following is the correct conclusion for the F-test that was performed? There is strong evidence to…Suppose that researchers obtain a random sample of adults ages 18 – 40 and collect data on the following variables: shoe size – in inches age – in years height – in inches forearm length – in inches Suppose further that a multiple linear regression model is fit to the resulting data set using R Studio and that the following output is obtained from it. Use this output to answer the question that follows: > summary(lm(shoesize ~ age + height + forearm, data = measures)) Coefficients: (Intercept)ageheightforearm Estimate10.14882 0.06045 -0.02108 -0.06479 Std. Error 4.49245 0.06838 0.06350 0.06847 t value2.259 0.884 -0.332 -0.946 Pr(>|t|) 0.0264 0.3792 0.7408 0.3467 Residual standard error: 1.719 on 85 degrees of freedomMultiple R-squared: 0.01983, Adjusted R-squared: -0.01477 F-statistic: 0.5731 on 3 and 85 DF, p-value: 0.6342 What is the test-statistic is used to test whether at least one of the explanatory variables is a significant predictor of…Suppose that researchers obtain a random sample of adults ages 18 – 40 and collect data on the following variables: shoe size – in inches age – in years height – in inches forearm length – in inches Suppose further that a multiple linear regression model is fit to the resulting data set using R Studio and that the following output is obtained from it. Use this output to answer the question that follows: > summary(lm(shoesize ~ age + height + forearm, data = measures)) Coefficients: (Intercept)ageheightforearm Estimate10.14882 0.06045 -0.02108 -0.06479 Std. Error 4.49245 0.06838 0.06350 0.06847 t value2.259 0.884 -0.332 -0.946 Pr(>|t|) 0.0264 0.3792 0.7408 0.3467 Residual standard error: 1.719 on 85 degrees of freedomMultiple R-squared: 0.01983, Adjusted R-squared: -0.01477 F-statistic: 0.5731 on 3 and 85 DF, p-value: 0.6342 Using the information from above, fill in the blanks for the least-squares regression equation. Input all values to 5…
