Calculator Resource: Desmos Graphing The capacities at which U.S. nuclear power plants are working are shown in table for various years. Year Percent 1975 56 1980 59 1985 58 1990 70 1995 76 2000 88 2004 89 Let f(t) be the capacity (in percent) at which U.S. nuclear power plants are working at t years since 1970. A model of the situation is f(t) = 0.027t2 + 0.216t + 53.296. Use a graphing calculator to draw the graph of the model and, in the same viewing window, the scattergram of the data. Does the model fit the data well? O The function is not a good model for the data O The function is a good model for the data. Estimate at what capacity U. S. nuclear power plants were working in 2010. % Round to the nearest whole percent. Predict when U. S. nuclear power plants will be working at full (100%) capacity. Enter the year this occurs. O Post to forum
Calculator Resource: Desmos Graphing The capacities at which U.S. nuclear power plants are working are shown in table for various years. Year Percent 1975 56 1980 59 1985 58 1990 70 1995 76 2000 88 2004 89 Let f(t) be the capacity (in percent) at which U.S. nuclear power plants are working at t years since 1970. A model of the situation is f(t) = 0.027t2 + 0.216t + 53.296. Use a graphing calculator to draw the graph of the model and, in the same viewing window, the scattergram of the data. Does the model fit the data well? O The function is not a good model for the data O The function is a good model for the data. Estimate at what capacity U. S. nuclear power plants were working in 2010. % Round to the nearest whole percent. Predict when U. S. nuclear power plants will be working at full (100%) capacity. Enter the year this occurs. O Post to forum

Algebra & Trigonometry with Analytic Geometry
13th Edition
ISBN:9781133382119
Author:Swokowski
Publisher:Swokowski
Chapter9: Systems Of Equations And Inequalities
Section9.1: Systems Of Equations
Problem 49E

Related questions

Concept explainers
Equations and Inequations
Equations and inequalities describe the relationship between two mathematical expressions.
Linear Functions
A linear function can just be a constant, or it can be the constant multiplied with the variable like x or y. If the variables are of the form, x2, x1/2 or y2 it is not linear. The exponent over the variables should always be 1.
Question
Transcribed Image Text:Calculator Resource: Desmos Graphing
D
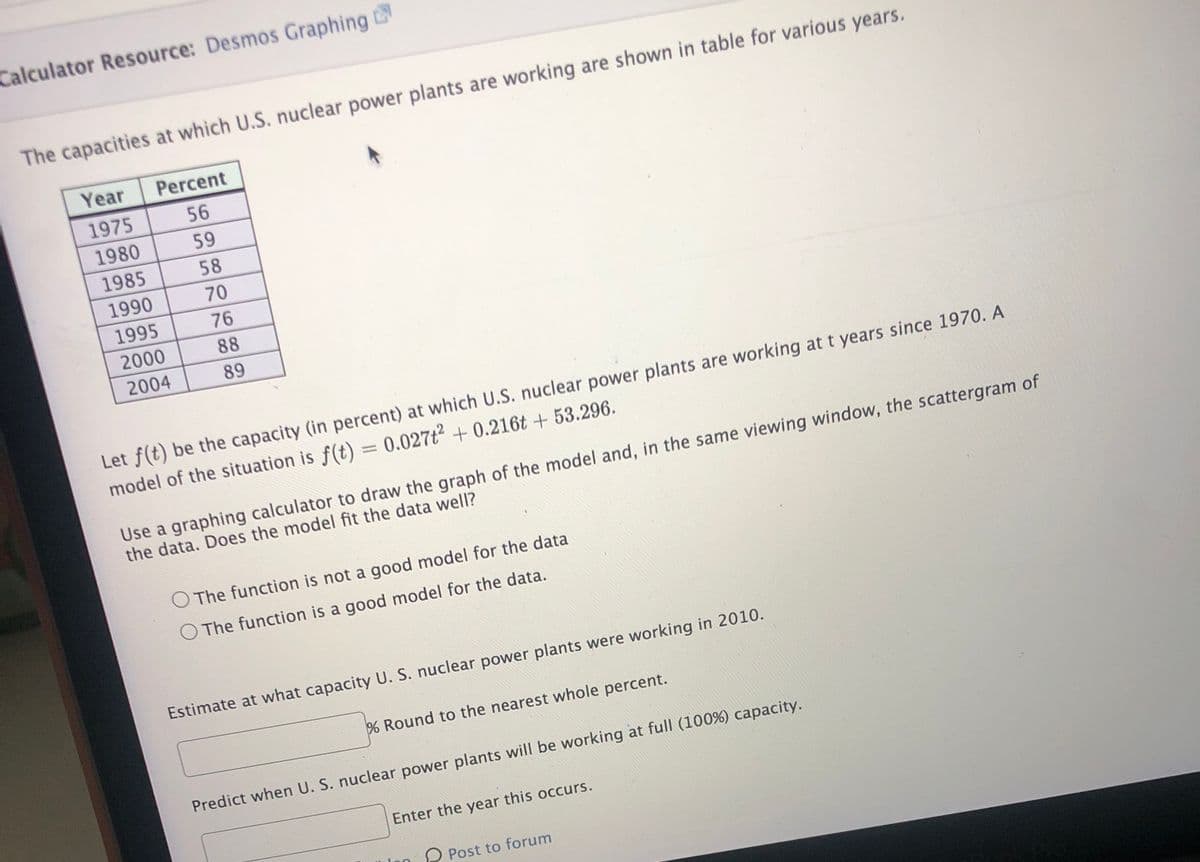
The capacities at which U.S. nuclear power plants are working are shown in table for various years.
Year
Percent
1975
56
1980
59
1985
58
1990
70
1995
76
2000
88
2004
89
Let f(t) be the capacity (in percent) at which U.S. nuclear power plants are working at t years since 1970. A
model of the situation is f(t) = 0.027t2 +0.216t + 53.296.
Use a graphing calculator to draw the graph of the model and, in the same viewing window, the scattergram of
the data. Does the model fit the data well?
O The function is not a good model for the data
The function is a good model for the data.
Estimate at what capacity U. S. nuclear power plants were working in 2010.
% Round to the nearest whole percent.
Predict when U. S. nuclear power plants will be working at full (100%) capacity.
Enter the year this occurs.
Post to forum
Expert Solution
This question has been solved!
Explore an expertly crafted, step-by-step solution for a thorough understanding of key concepts.

This is a popular solution!

Trending now
This is a popular solution!

Step by step
Solved in 2 steps with 2 images

Knowledge Booster


Learn more about
Need a deep-dive on the concept behind this application? Look no further. Learn more about this topic, algebra and related others by exploring similar questions and additional content below.Recommended textbooks for you
Algebra & Trigonometry with Analytic Geometry
Algebra
ISBN:
9781133382119
Author:
Swokowski
Publisher:
Cengage

Functions and Change: A Modeling Approach to Coll…
Algebra
ISBN:
9781337111348
Author:
Bruce Crauder, Benny Evans, Alan Noell
Publisher:
Cengage Learning

Linear Algebra: A Modern Introduction
Algebra
ISBN:
9781285463247
Author:
David Poole
Publisher:
Cengage Learning
Algebra & Trigonometry with Analytic Geometry
Algebra
ISBN:
9781133382119
Author:
Swokowski
Publisher:
Cengage
Functions and Change: A Modeling Approach to Coll…
Algebra
ISBN:
9781337111348
Author:
Bruce Crauder, Benny Evans, Alan Noell
Publisher:
Cengage Learning
Linear Algebra: A Modern Introduction
Algebra
ISBN:
9781285463247
Author:
David Poole
Publisher:
Cengage Learning