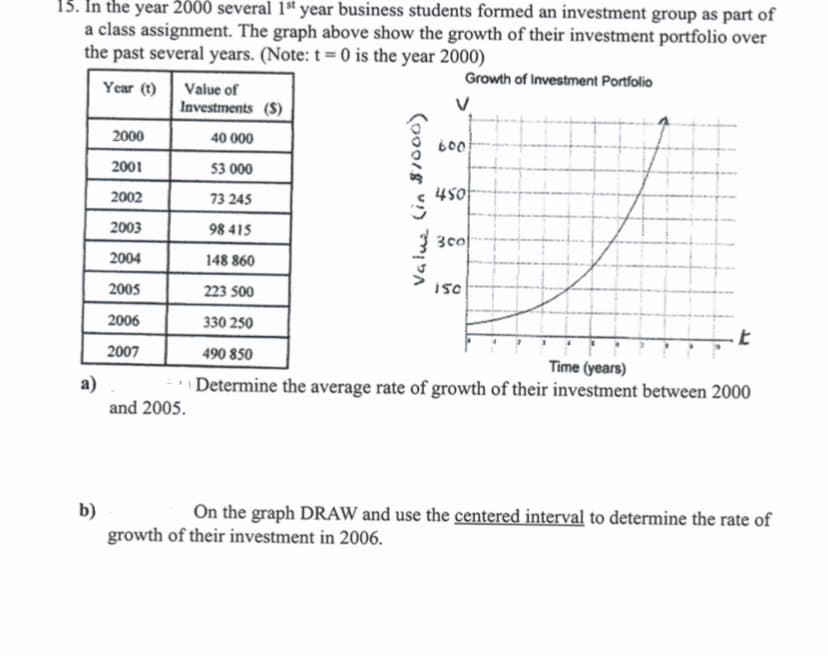
15. In the year 2000 several 1st year business students formed an investment group as part of a class assignment. The graph above show the growth of their investment portfolio over the past several years. (Note: t=0 is the year 2000) Growth of Investment Portfolio Year (t) Value of Investments (S) 2000 40 000 600 2001 53 000 450 2002 73 245 2003 98 415 300 2004 148 860 2005 223 500 150 2006 330 250 t 2007 490 850 Time (years) Determine the average rate of growth of their investment between 2000 and 2005. b) On the graph DRAW and use the centered interval to determine the rate of growth of their investment in 2006. a) Value (in $1000)
15. In the year 2000 several 1st year business students formed an investment group as part of a class assignment. The graph above show the growth of their investment portfolio over the past several years. (Note: t=0 is the year 2000) Growth of Investment Portfolio Year (t) Value of Investments (S) 2000 40 000 600 2001 53 000 450 2002 73 245 2003 98 415 300 2004 148 860 2005 223 500 150 2006 330 250 t 2007 490 850 Time (years) Determine the average rate of growth of their investment between 2000 and 2005. b) On the graph DRAW and use the centered interval to determine the rate of growth of their investment in 2006. a) Value (in $1000)

MATLAB: An Introduction with Applications
6th Edition
ISBN:9781119256830
Author:Amos Gilat
Publisher:Amos Gilat
Chapter1: Starting With Matlab
Section: Chapter Questions
Problem 1P

Related questions
Question
Transcribed Image Text:15. In the year 2000 several 1st year business students formed an investment group as part of
a class assignment. The graph above show the growth of their investment portfolio over
the past several years. (Note: t=0 is the year 2000)
Growth of Investment Portfolio
Year (t)
Value of
Investments (S)
2000
40 000
2001
53 000
2002
73 245
2003
98 415
2004
148 860
2005
223 500
150
2006
330 250
t
2007
490 850
Time (years)
Determine the average rate of growth of their investment between 2000
and 2005.
b)
On the graph DRAW and use the centered interval to determine the rate of
growth of their investment in 2006.
a)
Value (in $1000)
600
450
300
Expert Solution
This question has been solved!
Explore an expertly crafted, step-by-step solution for a thorough understanding of key concepts.

Step by step
Solved in 3 steps with 3 images

Recommended textbooks for you
MATLAB: An Introduction with Applications
Statistics
ISBN:
9781119256830
Author:
Amos Gilat
Publisher:
John Wiley & Sons Inc

Probability and Statistics for Engineering and th…
Statistics
ISBN:
9781305251809
Author:
Jay L. Devore
Publisher:
Cengage Learning

Statistics for The Behavioral Sciences (MindTap C…
Statistics
ISBN:
9781305504912
Author:
Frederick J Gravetter, Larry B. Wallnau
Publisher:
Cengage Learning
MATLAB: An Introduction with Applications
Statistics
ISBN:
9781119256830
Author:
Amos Gilat
Publisher:
John Wiley & Sons Inc
Probability and Statistics for Engineering and th…
Statistics
ISBN:
9781305251809
Author:
Jay L. Devore
Publisher:
Cengage Learning
Statistics for The Behavioral Sciences (MindTap C…
Statistics
ISBN:
9781305504912
Author:
Frederick J Gravetter, Larry B. Wallnau
Publisher:
Cengage Learning

Elementary Statistics: Picturing the World (7th E…
Statistics
ISBN:
9780134683416
Author:
Ron Larson, Betsy Farber
Publisher:
PEARSON

The Basic Practice of Statistics
Statistics
ISBN:
9781319042578
Author:
David S. Moore, William I. Notz, Michael A. Fligner
Publisher:
W. H. Freeman

Introduction to the Practice of Statistics
Statistics
ISBN:
9781319013387
Author:
David S. Moore, George P. McCabe, Bruce A. Craig
Publisher:
W. H. Freeman