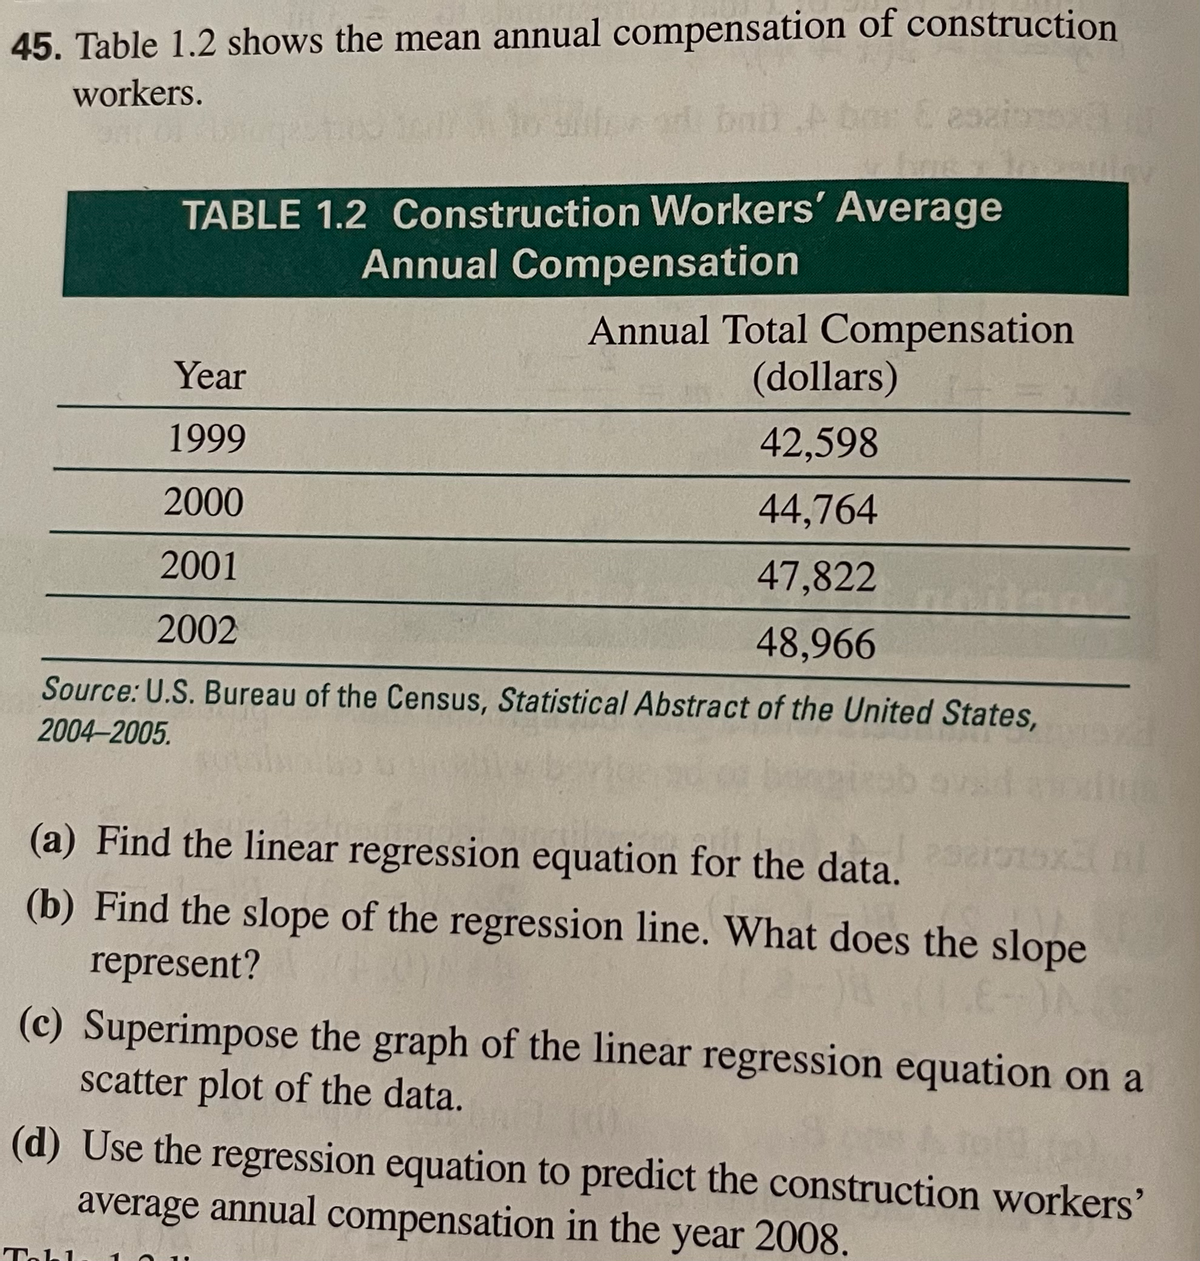
45. Table 1.2 shows the mean annual compensation of construction workers. bab Abor Cesaione TABLE 1.2 Construction Workers' Average Annual Compensation Annual Total Compensation (dollars) Year 1999 42,598 2000 44,764 2001 47,822 2002 48,966 Source: U.S. Bureau of the Census, Statistical Abstract of the United States, 2004-2005. (a) Find the linear regression equation for the data. (b) Find the slope of the regression line. What does the slope represent? (c) Superimpose the graph of the linear regression equation on a scatter plot of the data. (d) Use the regression equation to predict the construction workers' average annual compensation in the year 2008. Tabl
45. Table 1.2 shows the mean annual compensation of construction workers. bab Abor Cesaione TABLE 1.2 Construction Workers' Average Annual Compensation Annual Total Compensation (dollars) Year 1999 42,598 2000 44,764 2001 47,822 2002 48,966 Source: U.S. Bureau of the Census, Statistical Abstract of the United States, 2004-2005. (a) Find the linear regression equation for the data. (b) Find the slope of the regression line. What does the slope represent? (c) Superimpose the graph of the linear regression equation on a scatter plot of the data. (d) Use the regression equation to predict the construction workers' average annual compensation in the year 2008. Tabl

College Algebra
7th Edition
ISBN:9781305115545
Author:James Stewart, Lothar Redlin, Saleem Watson
Publisher:James Stewart, Lothar Redlin, Saleem Watson
Chapter1: Equations And Graphs
Section: Chapter Questions
Problem 10T: Olympic Pole Vault The graph in Figure 7 indicates that in recent years the winning Olympic men’s...

Related questions
Question
Transcribed Image Text:45. Table 1.2 shows the mean annual compensation of construction
workers.
bab Abor Cesaione
TABLE 1.2 Construction Workers' Average
Annual Compensation
Annual Total Compensation
(dollars)
Year
1999
42,598
2000
44,764
2001
47,822
2002
48,966
Source: U.S. Bureau of the Census, Statistical Abstract of the United States,
2004-2005.
(a) Find the linear regression equation for the data.
(b) Find the slope of the regression line. What does the slope
represent?
(c) Superimpose the graph of the linear regression equation on a
scatter plot of the data.
(d) Use the regression equation to predict the construction workers'
average annual compensation in the year 2008.
Tabl
Expert Solution
This question has been solved!
Explore an expertly crafted, step-by-step solution for a thorough understanding of key concepts.

This is a popular solution!

Trending now
This is a popular solution!

Step by step
Solved in 3 steps with 3 images

Recommended textbooks for you
College Algebra
Algebra
ISBN:
9781305115545
Author:
James Stewart, Lothar Redlin, Saleem Watson
Publisher:
Cengage Learning

Linear Algebra: A Modern Introduction
Algebra
ISBN:
9781285463247
Author:
David Poole
Publisher:
Cengage Learning

Trigonometry (MindTap Course List)
Trigonometry
ISBN:
9781305652224
Author:
Charles P. McKeague, Mark D. Turner
Publisher:
Cengage Learning
College Algebra
Algebra
ISBN:
9781305115545
Author:
James Stewart, Lothar Redlin, Saleem Watson
Publisher:
Cengage Learning
Linear Algebra: A Modern Introduction
Algebra
ISBN:
9781285463247
Author:
David Poole
Publisher:
Cengage Learning
Trigonometry (MindTap Course List)
Trigonometry
ISBN:
9781305652224
Author:
Charles P. McKeague, Mark D. Turner
Publisher:
Cengage Learning

Algebra and Trigonometry (MindTap Course List)
Algebra
ISBN:
9781305071742
Author:
James Stewart, Lothar Redlin, Saleem Watson
Publisher:
Cengage Learning

Glencoe Algebra 1, Student Edition, 9780079039897…
Algebra
ISBN:
9780079039897
Author:
Carter
Publisher:
McGraw Hill

Big Ideas Math A Bridge To Success Algebra 1: Stu…
Algebra
ISBN:
9781680331141
Author:
HOUGHTON MIFFLIN HARCOURT
Publisher:
Houghton Mifflin Harcourt