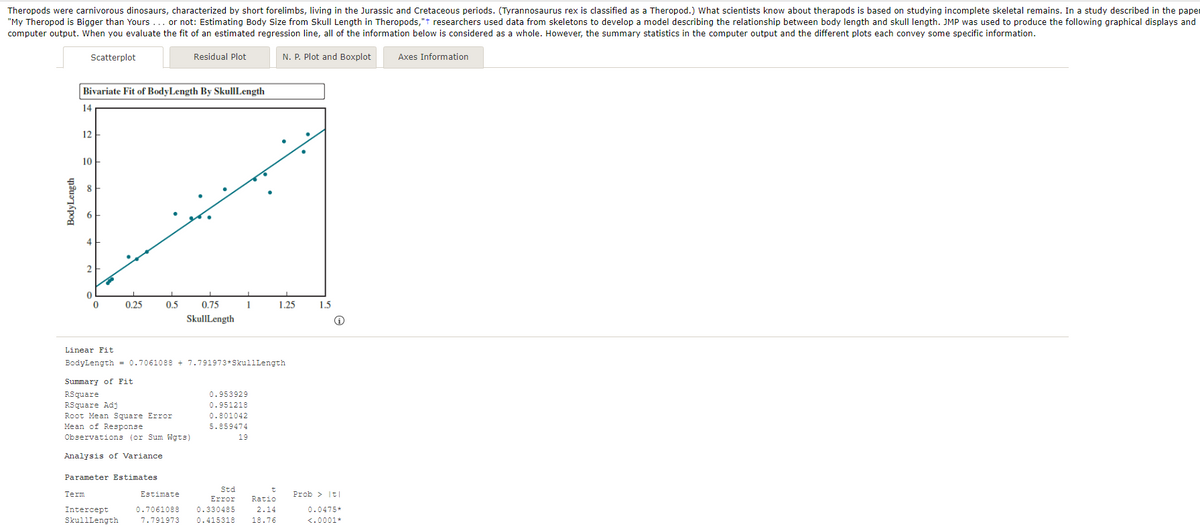
Using only the scatterplot, do you think a linear model does a good job of describing the relationship? Explain why or why not. The linear model (does/does not) do a good job of describing the relationship because the scatterplot is approximately (linear/nonlinear).   B) Using only the residual plot, what can you determine about whether the basic assumptions of the linear regression model are met?

Algebra & Trigonometry with Analytic Geometry
13th Edition
ISBN:9781133382119
Author:Swokowski
Publisher:Swokowski
Chapter2: Equations And Inequalities
Section2.7: More On Inequalities
Problem 44E
icon
Related questions
icon
Concept explainers
Question

3.

A) Using only the scatterplot, do you think a linear model does a good job of describing the relationship? Explain why or why not.
The linear model (does/does not) do a good job of describing the relationship because the scatterplot is approximately (linear/nonlinear).
 
B) Using only the residual plot, what can you determine about whether the basic assumptions of the linear regression model are met?
There (is/is not) an obvious pattern in the residual plot, which would indicate that the basic assumptions (are/are not) met.
 
C)
Using only the normal probability plot and boxplot of the residuals, what can you determine about whether the basic assumptions of the linear regression model are met?
The normal probability plot of the residuals is roughly (linear/nonlinear),  so the assumption that the distribution of e is approximately normal (is/ is not) reasonable. The boxplot of the residuals (nontains/ does not contain) an outlier, so there  (is/ is no)  doubt regarding the assumption of approximately normality.
 
D)
Using only the values of r2 and se, what can you say about the quality of the fit of the linear model for these data?
The (large/small)  value of r2 combined with the (large/small) value for se indicates that the linear model fits the data (poorly/well).
Theropods were carnivorous dinosaurs, characterized by short forelimbs, living in the Jurassic and Cretaceous periods. (Tyrannosaurus rex is classified as a Theropod.) What scientists know about therapods is based on studying incomplete skeletal remains. In a study described in the paper
"My Theropod is Bigger than Yours ... or not: Estimating Body Size from Skull Length in Theropods,"t researchers used data from skeletons to develop a model describing the relationship between body length and skull length. JMP was used to produce the following graphical displays and
computer output. When you evaluate the fit of an estimated regression line, all of the information below is considered as a whole. However, the summary statistics in the computer output and the different plots each convey some specific information.
Scatterplot
Residual Plot
N. P. Plot and Boxplot
Axes Information
Bivariate Fit of BodyLength By SkullLength
14
12
10
8
2
0.25
0.5
0.75
1
1.25
1.5
SkullLength
Linear Fit
BodyLength = 0.7061088 + 7.791973*SkullLength
Summary of Fit
RSquare
0.953929
RSquare Adj
0.951218
0.801042
Root Mean Square Error
Mean of Response
Observations (or Sum Wgts)
5.859474
19
Analysis of Variance
Parameter Estimates
Std
Term
Estimate
Prob > It|
Error
Ratio
Intercept
0.7061088
0.330485
2.14
0.0475*
SkullLength
7.791973
0.415318
18.76
<.0001*
BodyLength
Transcribed Image Text:Theropods were carnivorous dinosaurs, characterized by short forelimbs, living in the Jurassic and Cretaceous periods. (Tyrannosaurus rex is classified as a Theropod.) What scientists know about therapods is based on studying incomplete skeletal remains. In a study described in the paper "My Theropod is Bigger than Yours ... or not: Estimating Body Size from Skull Length in Theropods,"t researchers used data from skeletons to develop a model describing the relationship between body length and skull length. JMP was used to produce the following graphical displays and computer output. When you evaluate the fit of an estimated regression line, all of the information below is considered as a whole. However, the summary statistics in the computer output and the different plots each convey some specific information. Scatterplot Residual Plot N. P. Plot and Boxplot Axes Information Bivariate Fit of BodyLength By SkullLength 14 12 10 8 2 0.25 0.5 0.75 1 1.25 1.5 SkullLength Linear Fit BodyLength = 0.7061088 + 7.791973*SkullLength Summary of Fit RSquare 0.953929 RSquare Adj 0.951218 0.801042 Root Mean Square Error Mean of Response Observations (or Sum Wgts) 5.859474 19 Analysis of Variance Parameter Estimates Std Term Estimate Prob > It| Error Ratio Intercept 0.7061088 0.330485 2.14 0.0475* SkullLength 7.791973 0.415318 18.76 <.0001* BodyLength
Expert Solution
steps

Step by step

Solved in 2 steps

Blurred answer
Knowledge Booster
Correlation, Regression, and Association
Learn more about
Need a deep-dive on the concept behind this application? Look no further. Learn more about this topic, statistics and related others by exploring similar questions and additional content below.
Recommended textbooks for you
Algebra & Trigonometry with Analytic Geometry
Algebra
ISBN:
9781133382119
Author:
Swokowski
Publisher:
Cengage
Glencoe Algebra 1, Student Edition, 9780079039897…
Algebra
ISBN:
9780079039897
Author:
Carter
Publisher:
McGraw Hill
Big Ideas Math A Bridge To Success Algebra 1: Stu…
Algebra
ISBN:
9781680331141
Author:
HOUGHTON MIFFLIN HARCOURT
Publisher:
Houghton Mifflin Harcourt