Can there be a set of data fitting to both the following histograms? Which of these answers are correct? Histogram 1 Histogram 2 10 a) No, because the right one is calculated from positive data only. b) Yes, the right one includes all possible data from which the left one may be calculated. c) No, the right one must be calculated with at least one value greater than 8. d) No, the left one can not have been calculated with a value of 10 or more. 90'0 200 000 OL'D 00 0 0.15
Can there be a set of data fitting to both the following histograms? Which of these answers are correct? Histogram 1 Histogram 2 10 a) No, because the right one is calculated from positive data only. b) Yes, the right one includes all possible data from which the left one may be calculated. c) No, the right one must be calculated with at least one value greater than 8. d) No, the left one can not have been calculated with a value of 10 or more. 90'0 200 000 OL'D 00 0 0.15

Glencoe Algebra 1, Student Edition, 9780079039897, 0079039898, 2018
18th Edition
ISBN:9780079039897
Author:Carter
Publisher:Carter
Chapter10: Statistics
Section10.3: Measures Of Spread
Problem 1GP

Related questions

Topic Video
Question
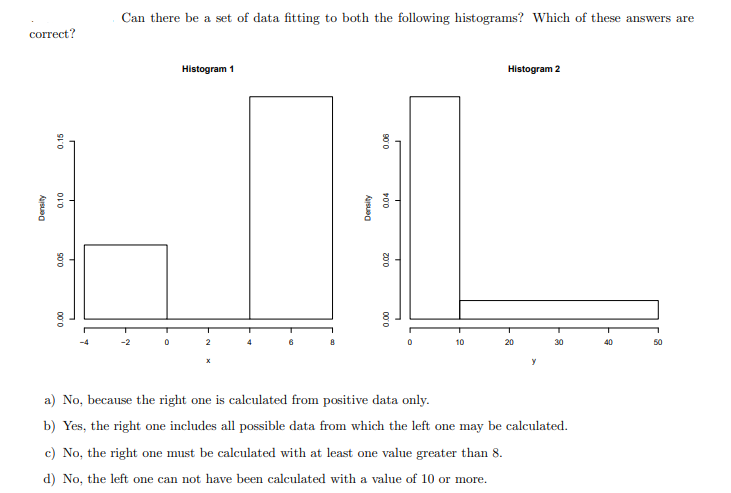
Transcribed Image Text:Can there be a set of data fitting to both the following histograms? Which of these answers are
correct?
Histogram 1
Histogram 2
10
20
30
40
50
y
a) No, because the right one is calculated from positive data only.
b) Yes, the right one includes all possible data from which the left one may be calculated.
c) No, the right one must be calculated with at least one value greater than 8.
d) No, the left one can not have been calculated with a value of 10 or more.
90 0
z00
000
000
0.15
0.10
Expert Solution
This question has been solved!
Explore an expertly crafted, step-by-step solution for a thorough understanding of key concepts.

This is a popular solution!

Trending now
This is a popular solution!

Step by step
Solved in 2 steps

Knowledge Booster


Learn more about
Need a deep-dive on the concept behind this application? Look no further. Learn more about this topic, statistics and related others by exploring similar questions and additional content below.Recommended textbooks for you
Glencoe Algebra 1, Student Edition, 9780079039897…
Algebra
ISBN:
9780079039897
Author:
Carter
Publisher:
McGraw Hill

Algebra & Trigonometry with Analytic Geometry
Algebra
ISBN:
9781133382119
Author:
Swokowski
Publisher:
Cengage
Glencoe Algebra 1, Student Edition, 9780079039897…
Algebra
ISBN:
9780079039897
Author:
Carter
Publisher:
McGraw Hill
Algebra & Trigonometry with Analytic Geometry
Algebra
ISBN:
9781133382119
Author:
Swokowski
Publisher:
Cengage