(a) Is there a relationship between the observations collected in 1968 and 2008? Or are the observations in the two groups independent? Explain. (b) Write hypotheses for this research in symbols and in words. (c) Check the conditions required to complete this test.
(a) Is there a relationship between the observations collected in 1968 and 2008? Or are the observations in the two groups independent? Explain. (b) Write hypotheses for this research in symbols and in words. (c) Check the conditions required to complete this test.

MATLAB: An Introduction with Applications
6th Edition
ISBN:9781119256830
Author:Amos Gilat
Publisher:Amos Gilat
Chapter1: Starting With Matlab
Section: Chapter Questions
Problem 1P

Related questions
Question
Please write it step by step with no software for computing the problems
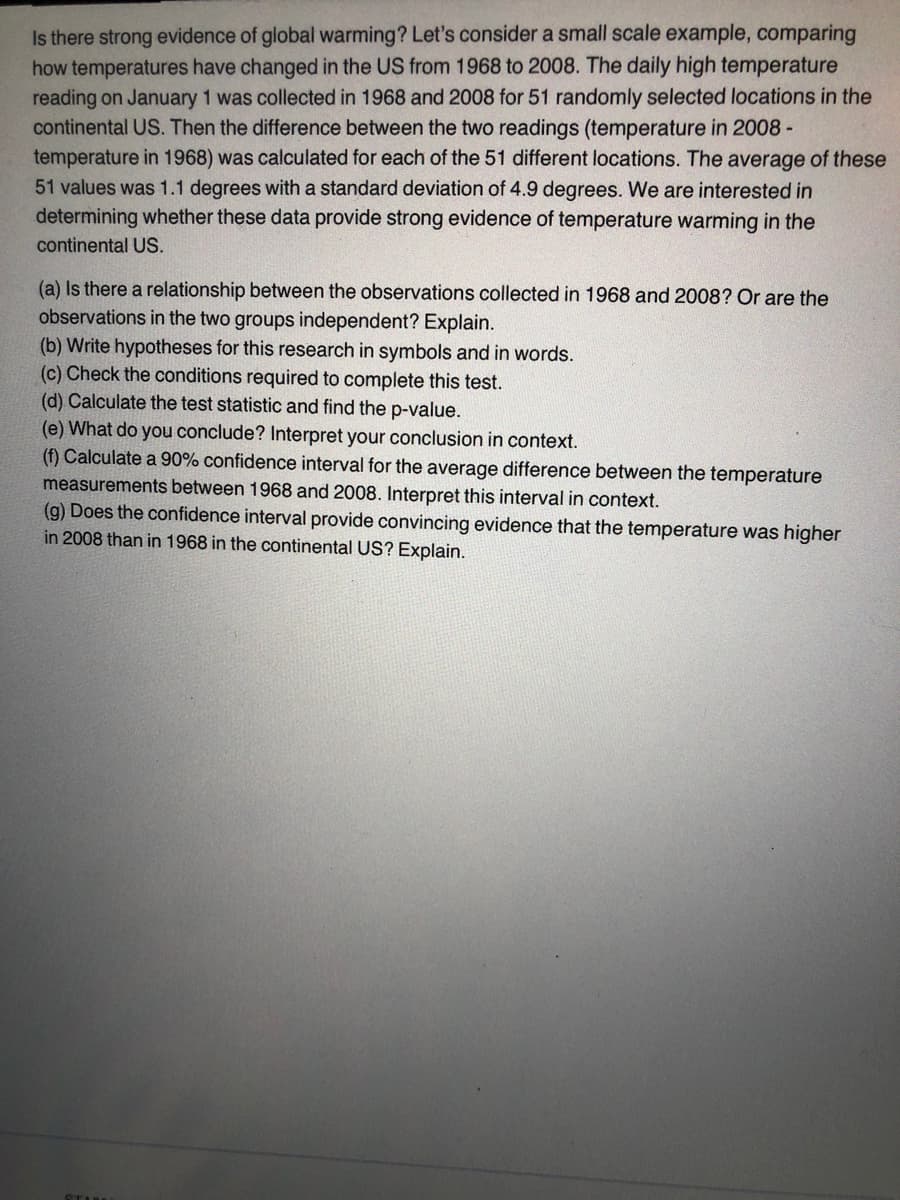
Transcribed Image Text:Is there strong evidence of global warming? Let's consider a small scale example, comparing
how temperatures have changed in the US from 1968 to 2008. The daily high temperature
reading on January 1 was collected in 1968 and 2008 for 51 randomly selected locations in the
continental US. Then the difference between the two readings (temperature in 2008 -
temperature in 1968) was calculated for each of the 51 different locations. The average of these
51 values was 1.1 degrees with a standard deviation of 4.9 degrees. We are interested in
determining whether these data provide strong evidence of temperature warming in the
continental US.
(a) Is there a relationship between the observations collected in 1968 and 2008? Or are the
observations in the two groups independent? Explain.
(b) Write hypotheses for this research in symbols and in words.
(c) Check the conditions required to complete this test.
(d) Calculate the test statistic and find the p-value.
(e) What do you conclude? Interpret your conclusion in context.
(f) Calculate a 90% confidence interval for the average difference between the temperature
measurements between 1968 and 2008. Interpret this interval in context.
(g) Does the confidence interval provide convincing evidence that the temperature was higher
in 2008 than in 1968 in the continental US? Explain.
Expert Solution
This question has been solved!
Explore an expertly crafted, step-by-step solution for a thorough understanding of key concepts.

This is a popular solution!

Trending now
This is a popular solution!

Step by step
Solved in 2 steps

Knowledge Booster


Learn more about
Need a deep-dive on the concept behind this application? Look no further. Learn more about this topic, statistics and related others by exploring similar questions and additional content below.Recommended textbooks for you
MATLAB: An Introduction with Applications
Statistics
ISBN:
9781119256830
Author:
Amos Gilat
Publisher:
John Wiley & Sons Inc

Probability and Statistics for Engineering and th…
Statistics
ISBN:
9781305251809
Author:
Jay L. Devore
Publisher:
Cengage Learning

Statistics for The Behavioral Sciences (MindTap C…
Statistics
ISBN:
9781305504912
Author:
Frederick J Gravetter, Larry B. Wallnau
Publisher:
Cengage Learning
MATLAB: An Introduction with Applications
Statistics
ISBN:
9781119256830
Author:
Amos Gilat
Publisher:
John Wiley & Sons Inc
Probability and Statistics for Engineering and th…
Statistics
ISBN:
9781305251809
Author:
Jay L. Devore
Publisher:
Cengage Learning
Statistics for The Behavioral Sciences (MindTap C…
Statistics
ISBN:
9781305504912
Author:
Frederick J Gravetter, Larry B. Wallnau
Publisher:
Cengage Learning

Elementary Statistics: Picturing the World (7th E…
Statistics
ISBN:
9780134683416
Author:
Ron Larson, Betsy Farber
Publisher:
PEARSON

The Basic Practice of Statistics
Statistics
ISBN:
9781319042578
Author:
David S. Moore, William I. Notz, Michael A. Fligner
Publisher:
W. H. Freeman

Introduction to the Practice of Statistics
Statistics
ISBN:
9781319013387
Author:
David S. Moore, George P. McCabe, Bruce A. Craig
Publisher:
W. H. Freeman