Ka Ming Metal Manufacturing Ltd. (KM) and Sun Tool Metal Engineering works Ltd. (ST) are heavy metal companies and reported the following financial statements for the year of 2021. Balance Sheet as at December 31, 2021 KM $ ST $ Current assets 27,500,000 22,000,000 Net fixed assets 25,000,000 17,000,000 Total assets 52,500,000 39,000,000 Current liabilities 20,000,000 15,000,000 Long-term debt 8,000,000 8,000,000 Total liabilities 28,000,000 23,000,000 Shareholders’ equity Common stock 15,500,000 9,000,000 Retained earnings 9,000,000 7,000,000 Total shareholders’ equity 24,500,000 16,000,000 Total liabilities and shareholder' equity 52,500,000 39,000,000 Income Statement For the Year Ended December 31, 2021 KM $ ST $ Sales 66,000,000 48,000,000 Cost of goods sold (35,000,000) (22,000,000) Selling and administrative (10,000,000) (10,000,000) Depreciation (8,000,000) (6,000,000) ЕBIT 13,000,000 10,000,000 Interest (3,000,000) (1,900,000) Taxable income 10,000,000 8,100,000 Тахes (2,800,000) (2,268,000) Net income 7,200,000 5,832,000 Dividends 2,000,000 1,000,000 Addition to retained earnings 5,200,000 4,832,000
Ka Ming Metal Manufacturing Ltd. (KM) and Sun Tool Metal Engineering works Ltd. (ST) are heavy metal companies and reported the following financial statements for the year of 2021. Balance Sheet as at December 31, 2021 KM $ ST $ Current assets 27,500,000 22,000,000 Net fixed assets 25,000,000 17,000,000 Total assets 52,500,000 39,000,000 Current liabilities 20,000,000 15,000,000 Long-term debt 8,000,000 8,000,000 Total liabilities 28,000,000 23,000,000 Shareholders’ equity Common stock 15,500,000 9,000,000 Retained earnings 9,000,000 7,000,000 Total shareholders’ equity 24,500,000 16,000,000 Total liabilities and shareholder' equity 52,500,000 39,000,000 Income Statement For the Year Ended December 31, 2021 KM $ ST $ Sales 66,000,000 48,000,000 Cost of goods sold (35,000,000) (22,000,000) Selling and administrative (10,000,000) (10,000,000) Depreciation (8,000,000) (6,000,000) ЕBIT 13,000,000 10,000,000 Interest (3,000,000) (1,900,000) Taxable income 10,000,000 8,100,000 Тахes (2,800,000) (2,268,000) Net income 7,200,000 5,832,000 Dividends 2,000,000 1,000,000 Addition to retained earnings 5,200,000 4,832,000

Financial Management: Theory & Practice
16th Edition
ISBN:9781337909730
Author:Brigham
Publisher:Brigham
Chapter2: Financial Statements, Cash Flow,and Taxes
Section: Chapter Questions
Problem 17P: Athenian Venues Inc. just reported the following selected portion of its financial statements for...

Related questions
Question
(a) Show the workings for the following financial ratios for Ka Ming Metal Manufacturing Ltd.
(KM) and Sun Tool Metal Engineering works Ltd. (ST) during the year of 2021. (Shown in the photo below)
(round final answer to 2 decimal places, thanks)
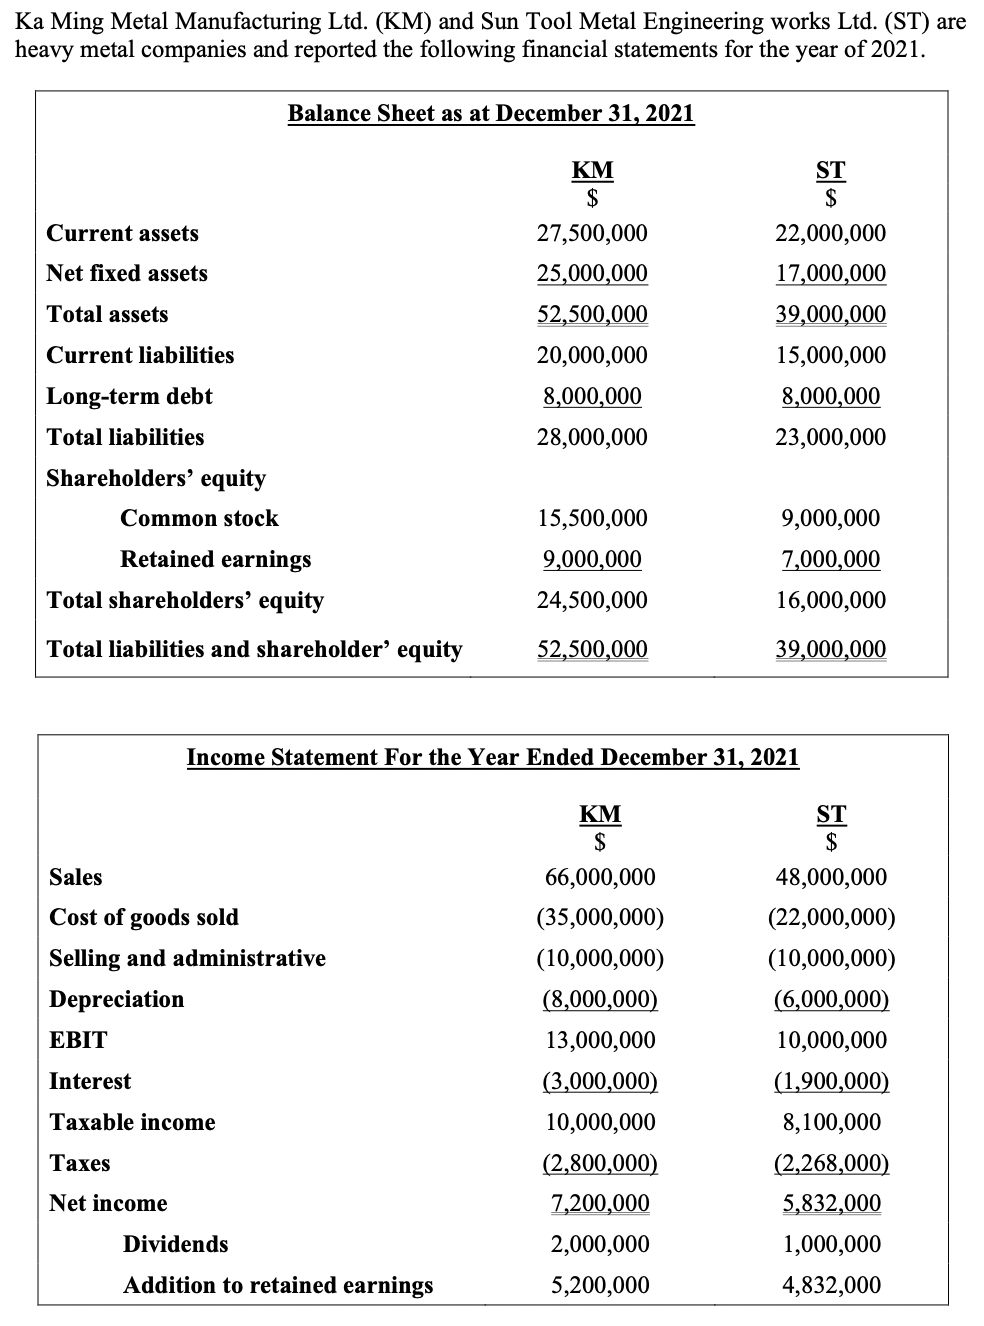
Transcribed Image Text:Ka Ming Metal Manufacturing Ltd. (KM) and Sun Tool Metal Engineering works Ltd. (ST) are
heavy metal companies and reported the following financial statements for the year of 2021.
Balance Sheet as at December 31, 2021
KM
$
ST
$
Current assets
27,500,000
22,000,000
Net fixed assets
25,000,000
17,000,000
Total assets
52,500,000
39,000,000
Current liabilities
20,000,000
15,000,000
Long-term debt
8,000,000
8,000,000
Total liabilities
28,000,000
23,000,000
Shareholders’ equity
Common stock
15,500,000
9,000,000
Retained earnings
9,000,000
7,000,000
Total shareholders' equity
24,500,000
16,000,000
Total liabilities and shareholder’ equity
52,500,000
39,000,000
Income Statement For the Year Ended December 31, 2021
KM
$
ST
$
Sales
66,000,000
48,000,000
Cost of goods sold
(35,000,000)
(22,000,000)
Selling and administrative
(10,000,000)
(10,000,000)
Depreciation
(8,000,000)
(6,000,000)
ЕBIT
13,000,000
10,000,000
Interest
(3,000,000)
(1,900,000)
Taxable income
10,000,000
8,100,000
Тахes
(2,800,000)
(2,268,000)
Net income
7,200,000
5,832,000
Dividends
2,000,000
1,000,000
Addition to retained earnings
5,200,000
4,832,000
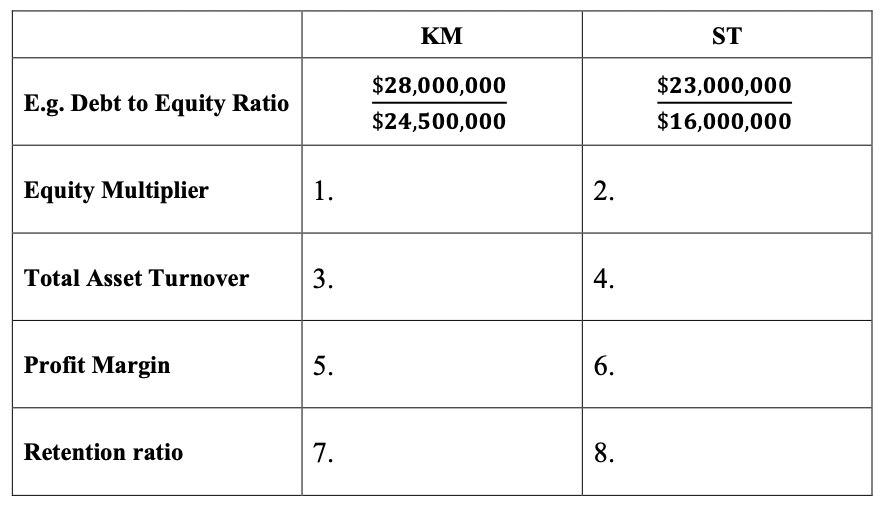
Transcribed Image Text:KM
ST
$28,000,000
$23,000,000
E.g. Debt to Equity Ratio
$24,500,000
$16,000,000
Equity Multiplier
1.
Total Asset Turnover
3.
4.
Profit Margin
5.
6.
Retention ratio
7.
8.
2.
Expert Solution
This question has been solved!
Explore an expertly crafted, step-by-step solution for a thorough understanding of key concepts.

Step by step
Solved in 4 steps

Follow-up Questions
Read through expert solutions to related follow-up questions below.
Follow-up Question
can u help me finish the other sub parts from 4-8
thanks a lot!
Solution
Knowledge Booster


Learn more about
Need a deep-dive on the concept behind this application? Look no further. Learn more about this topic, accounting and related others by exploring similar questions and additional content below.Recommended textbooks for you

Cornerstones of Financial Accounting
Accounting
ISBN:
9781337690881
Author:
Jay Rich, Jeff Jones
Publisher:
Cengage Learning

Intermediate Accounting: Reporting And Analysis
Accounting
ISBN:
9781337788281
Author:
James M. Wahlen, Jefferson P. Jones, Donald Pagach
Publisher:
Cengage Learning
Cornerstones of Financial Accounting
Accounting
ISBN:
9781337690881
Author:
Jay Rich, Jeff Jones
Publisher:
Cengage Learning
Intermediate Accounting: Reporting And Analysis
Accounting
ISBN:
9781337788281
Author:
James M. Wahlen, Jefferson P. Jones, Donald Pagach
Publisher:
Cengage Learning

Survey of Accounting (Accounting I)
Accounting
ISBN:
9781305961883
Author:
Carl Warren
Publisher:
Cengage Learning

Fundamentals Of Financial Management, Concise Edi…
Finance
ISBN:
9781337902571
Author:
Eugene F. Brigham, Joel F. Houston
Publisher:
Cengage Learning