Can you please solve the question?

MATLAB: An Introduction with Applications
6th Edition
ISBN:9781119256830
Author:Amos Gilat
Publisher:Amos Gilat
Chapter1: Starting With Matlab
Section: Chapter Questions
Problem 1P

Related questions

Topic Video
Question
Can you please solve the question?
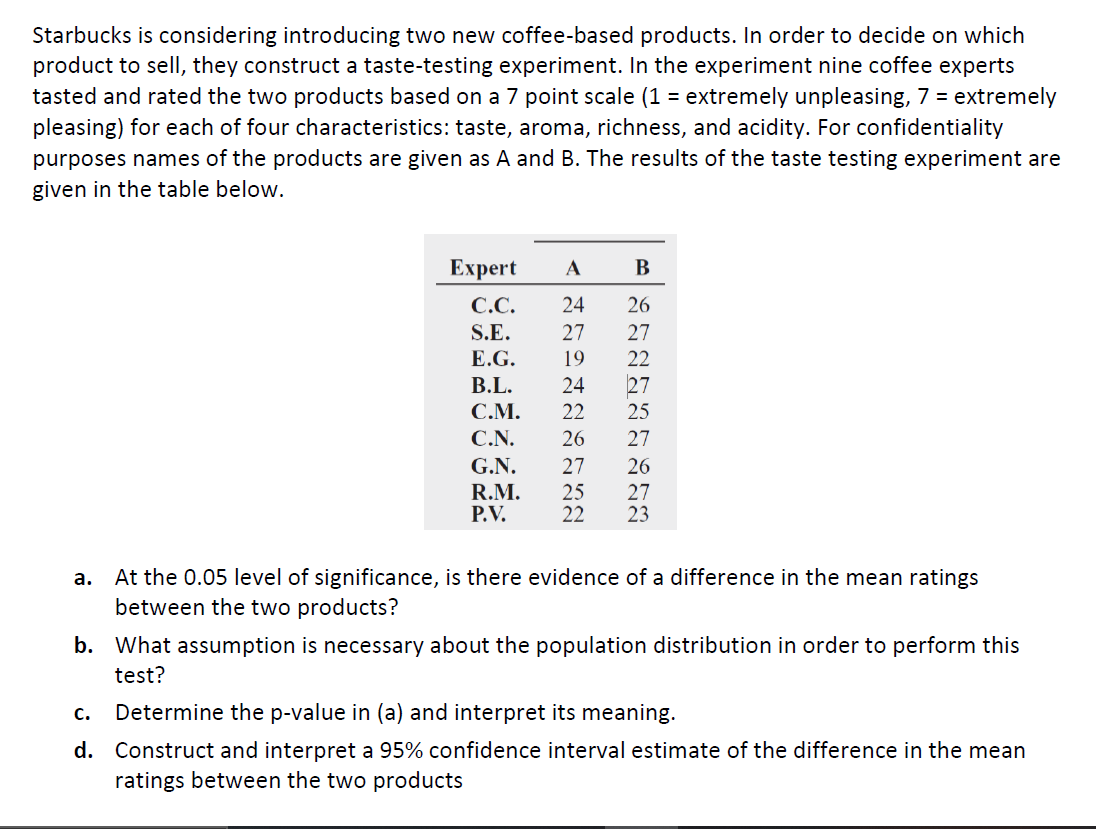
Transcribed Image Text:Starbucks is considering introducing two new coffee-based products. In order to decide on which
product to selI, they construct a taste-testing experiment. In the experiment nine coffee experts
tasted and rated the two products based on a 7 point scale (1 = extremely unpleasing, 7 = extremely
pleasing) for each of four characteristics: taste, aroma, richness, and acidity. For confidentiality
purposes names of the products are given as A and B. The results of the taste testing experiment are
given in the table below.
Expert
A
В
C.C.
24
26
S.E.
27
27
E.G.
19
22
B.L.
24
27
С.М.
22
25
C.Ν.
26
27
G.N.
27
26
R.M.
P.V.
25
22
27
23
At the 0.05 level of significance, is there evidence of a difference in the mean ratings
between the two products?
а.
b. What assumption is necessary about the population distribution in order to perform this
test?
с.
Determine the p-value in (a) and interpret its meaning.
d. Construct and interpret a 95% confidence interval estimate of the difference in the mean
ratings between the two products
Expert Solution
This question has been solved!
Explore an expertly crafted, step-by-step solution for a thorough understanding of key concepts.

Step by step
Solved in 4 steps

Knowledge Booster


Learn more about
Need a deep-dive on the concept behind this application? Look no further. Learn more about this topic, statistics and related others by exploring similar questions and additional content below.Recommended textbooks for you
MATLAB: An Introduction with Applications
Statistics
ISBN:
9781119256830
Author:
Amos Gilat
Publisher:
John Wiley & Sons Inc

Probability and Statistics for Engineering and th…
Statistics
ISBN:
9781305251809
Author:
Jay L. Devore
Publisher:
Cengage Learning

Statistics for The Behavioral Sciences (MindTap C…
Statistics
ISBN:
9781305504912
Author:
Frederick J Gravetter, Larry B. Wallnau
Publisher:
Cengage Learning
MATLAB: An Introduction with Applications
Statistics
ISBN:
9781119256830
Author:
Amos Gilat
Publisher:
John Wiley & Sons Inc
Probability and Statistics for Engineering and th…
Statistics
ISBN:
9781305251809
Author:
Jay L. Devore
Publisher:
Cengage Learning
Statistics for The Behavioral Sciences (MindTap C…
Statistics
ISBN:
9781305504912
Author:
Frederick J Gravetter, Larry B. Wallnau
Publisher:
Cengage Learning

Elementary Statistics: Picturing the World (7th E…
Statistics
ISBN:
9780134683416
Author:
Ron Larson, Betsy Farber
Publisher:
PEARSON

The Basic Practice of Statistics
Statistics
ISBN:
9781319042578
Author:
David S. Moore, William I. Notz, Michael A. Fligner
Publisher:
W. H. Freeman

Introduction to the Practice of Statistics
Statistics
ISBN:
9781319013387
Author:
David S. Moore, George P. McCabe, Bruce A. Craig
Publisher:
W. H. Freeman