Capstone Project Information Company: Organix Cereals (a fictional company) is a small producer of specialty organic breakfast cereal. Its signature product is Gluten-Free Organic Crispies, sold directly online to consumers. The company sells approximately 4 million boxes annually. Box label weight: 623 grams Price per box: $6.00 Cost of goods sold (per box): $4.00 (based on historical mean weight of 625 grams) Company Standards: In the automated packaging process, equipment is set to fill boxes with a mean weight of 625 grams and a standard deviation of 6 grams. This is the company standard for the box weights. As a small, independent producer of breakfast cereals, Organix uses older equipment and technology in its packaging process. Accordingly, the process results in boxes that are not always packed with exactly 623 grams (weight stated on label). The company sets the equipment to a target weight slightly higher than the weight stated on the box label to avoid penalties imposed by government inspectors if the box weights do not meet the government standards, and to ensure that customers receive the amount of cereal for which they pay. This is a common industry practice. Government Standards: Failure to meet government standards can result in fines of $200,000 or more, litigation, and negative publicity for the company and its brand. The government is not concerned if the company is overfilling boxes. 1.Penalties can be assessed against a company when any individual package weighs less than the Maximum Allowable Variation (MAV). The Maximum Allowable Variation (MAV) is the limit of “reasonable variation” for an individual package based on the NIST Handbook 133.The MAV is 23.5 grams below the declared box label weight of 623 grams. The lowest allowable weight, LMAV, is found by taking the label weight minus the MAV. 2.The company can also be penalized if the average package weight does not at least meet the declared box label weight of 623 grams. Data: The company recently took a random sample of 500 boxes of their signature cereal and measured their exact weights. The goals of this internal audit were to determine whether (1.) the company is meeting the targets set by management, and (2.) the company is in compliance with government regulations. The data that resulted from this sample can be found on the Excel workbook labeled Capstone Project Data SS2021. Analysis: Three templates are provided to guide your analysis. Your group must submit all three completed templates along with the final report in BlackBoard. The questions in the templates include the minimum requirements for your analysis in this project. Your group may choose to do additional statistical and business analysis beyond the minimum requirements in the templates. For Template 1, you will use the data on the tab labeled Cereal Weights. This data will also be used for the first part of Template 2. Also for Template 2 you will use data found on the tab labeled Weights after Adjustment. For Template 3 you will use the data found on the tab labeled Weights and Speeds. Hint: Whenever you calculate descriptive statistics using Excel, remember to check not only Summary Statistics but also Confidence Level (defaults to 95% confidence) to save your group some time when required to calculate interval estimates (confidence intervals). Keep in mind that the statistical analysis required in the templates is the minimum analysis required. Capstone Project Part 1 Template Descriptive Statistics: Using Excel, calculate the following descriptive statistics and then interpret the results in context using a business perspective. The analysis/interpretation should tell management what the descriptive statistic is revealing about the performance of the packaging process. Excel sheet:3 Speed Setting (Boxes Per Minute) Actual Box Weight 30 633.2242 30 633.1766 30 633.1218 30 633.1188 30 633.1122 30 633.1114 30 631.9987 30 632.8714 30 633.0902 30 633.0505 30 633.0093 30 633.0088 30 633.0075 30 633.0067 30 633.0055 30 632.9979 30 632.9898 30 632.8887 30 632.7764 30 631.7997 32 629.7675 32 628.5659 32 628.4444 32 628.2141 32 629.9966 32 631.5454 32 628.3111 32 628.1105 32 628.1006 32 628.0301 32 628.0203 32 628.0107 32 628.0102 32 628.0061 32 628.0003 32 628.0002 32 627.9999 32 627.9944 32 627.8878 32 627.7675 35 626.0017 35 625.5552 35 625.3337 35 625.2451 35 625.1004 35 625.1922 35 625.0707 35 625.0444 35 625.0267 35 625.0092 35 624.6061 35 625.7712 35 625.0076 35 625.0063 35 624.9999 35 624.9988 35 624.8889 35 624.8886 35 624.7978 35 623.7777 38 616.7716 38 615.3136 38 615.2655 38 615.2244 38 615.2243 38 615.1776 38 615.0907 38 615.0807 38 615.0444 38 615.0522 38 615.0303 38 615.0201 38 615.0102 38 615.0018 38 615.0008 38 616.1212 38 616.4545 38 614.9997 38 614.9929 38 614.7899 40 612.0106 40 611.0082 40 611.0007 40 611.0001 40 610.6844 40 610.6663 40 610.5516 40 610.5004 40 610.3323 40 610.3024 40 610.1447 40 610.1201 40 610.1161 40 610.2021 40 610.0202 40 610.0099 40 610.0175 40 610.0002 40 609.9997 40 611.2888


Inverse Normal Distribution
The method used for finding the corresponding z-critical value in a normal distribution using the known probability is said to be an inverse normal distribution. The inverse normal distribution is a continuous probability distribution with a family of two parameters.
Mean, Median, Mode
It is a descriptive summary of a data set. It can be defined by using some of the measures. The central tendencies do not provide information regarding individual data from the dataset. However, they give a summary of the data set. The central tendency or measure of central tendency is a central or typical value for a probability distribution.
Z-Scores
A z-score is a unit of measurement used in statistics to describe the position of a raw score in terms of its distance from the mean, measured with reference to standard deviation from the mean. Z-scores are useful in statistics because they allow comparison between two scores that belong to different normal distributions.
Capstone Project Information
Company: Organix Cereals (a fictional company) is a small producer of specialty organic breakfast cereal. Its signature product is Gluten-Free Organic Crispies, sold directly online to consumers. The company sells approximately 4 million boxes annually.
Box label weight: 623 grams
Price per box: $6.00
Cost of goods sold (per box): $4.00 (based on historical mean weight of 625 grams)
Company Standards: In the automated packaging process, equipment is set to fill boxes with a mean weight of 625 grams and a standard deviation of 6 grams. This is the company standard for the box weights. As a small, independent producer of breakfast cereals, Organix uses older equipment and technology in its packaging process. Accordingly, the process results in boxes that are not always packed with exactly 623 grams (weight stated on label).
The company sets the equipment to a target weight slightly higher than the weight stated on the box label to avoid penalties imposed by government inspectors if the box weights do not meet the government standards, and to ensure that customers receive the amount of cereal for which they pay. This is a common industry practice.
Government Standards: Failure to meet government standards can result in fines of $200,000 or more, litigation, and negative publicity for the company and its brand. The government is not concerned if the company is overfilling boxes.
1.Penalties can be assessed against a company when any individual package weighs less than the Maximum Allowable Variation (MAV). The Maximum Allowable Variation (MAV) is the limit of “reasonable variation” for an individual package based on the NIST Handbook 133.The MAV is 23.5 grams below the declared box label weight of 623 grams. The lowest allowable weight, LMAV, is found by taking the label weight minus the MAV.
2.The company can also be penalized if the average package weight does not at least meet the declared box label weight of 623 grams.
Data: The company recently took a random sample of 500 boxes of their signature cereal and measured their exact weights. The goals of this internal audit were to determine whether (1.) the company is meeting the targets set by management, and (2.) the company is in compliance with government regulations. The data that resulted from this sample can be found on the Excel workbook labeled Capstone Project Data SS2021.
Analysis: Three templates are provided to guide your analysis. Your group must submit all three completed templates along with the final report in BlackBoard. The questions in the templates include the minimum requirements for your analysis in this project. Your group may choose to do additional statistical and business analysis beyond the minimum requirements in the templates.
For Template 1, you will use the data on the tab labeled Cereal Weights. This data will also be used for the first part of Template 2. Also for Template 2 you will use data found on the tab labeled Weights after Adjustment. For Template 3 you will use the data found on the tab labeled Weights and Speeds.
Hint: Whenever you calculate
Keep in mind that the statistical analysis required in the templates is the minimum analysis required.
Capstone Project Part 1 Template
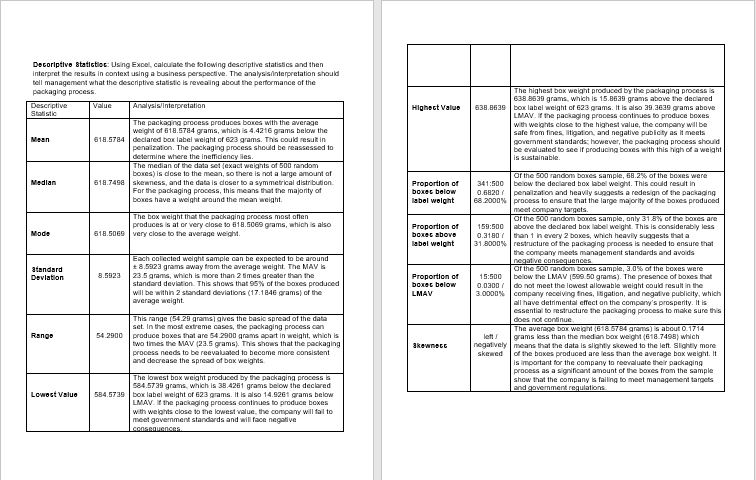
Descriptive Statistics: Using Excel, calculate the following descriptive statistics and then interpret the results in context using a business perspective. The analysis/interpretation should tell management what the descriptive statistic is revealing about the performance of the packaging process.
Excel sheet:3
| Speed Setting (Boxes Per Minute) | Actual Box Weight | |
| 30 | 633.2242 | |
| 30 | 633.1766 | |
| 30 | 633.1218 | |
| 30 | 633.1188 | |
| 30 | 633.1122 | |
| 30 | 633.1114 | |
| 30 | 631.9987 | |
| 30 | 632.8714 | |
| 30 | 633.0902 | |
| 30 | 633.0505 | |
| 30 | 633.0093 | |
| 30 | 633.0088 | |
| 30 | 633.0075 | |
| 30 | 633.0067 | |
| 30 | 633.0055 | |
| 30 | 632.9979 | |
| 30 | 632.9898 | |
| 30 | 632.8887 | |
| 30 | 632.7764 | |
| 30 | 631.7997 | |
| 32 | 629.7675 | |
| 32 | 628.5659 | |
| 32 | 628.4444 | |
| 32 | 628.2141 | |
| 32 | 629.9966 | |
| 32 | 631.5454 | |
| 32 | 628.3111 | |
| 32 | 628.1105 | |
| 32 | 628.1006 | |
| 32 | 628.0301 | |
| 32 | 628.0203 | |
| 32 | 628.0107 | |
| 32 | 628.0102 | |
| 32 | 628.0061 | |
| 32 | 628.0003 | |
| 32 | 628.0002 | |
| 32 | 627.9999 | |
| 32 | 627.9944 | |
| 32 | 627.8878 | |
| 32 | 627.7675 | |
| 35 | 626.0017 | |
| 35 | 625.5552 | |
| 35 | 625.3337 | |
| 35 | 625.2451 | |
| 35 | 625.1004 | |
| 35 | 625.1922 | |
| 35 | 625.0707 | |
| 35 | 625.0444 | |
| 35 | 625.0267 | |
| 35 | 625.0092 | |
| 35 | 624.6061 | |
| 35 | 625.7712 | |
| 35 | 625.0076 | |
| 35 | 625.0063 | |
| 35 | 624.9999 | |
| 35 | 624.9988 | |
| 35 | 624.8889 | |
| 35 | 624.8886 | |
| 35 | 624.7978 | |
| 35 | 623.7777 | |
| 38 | 616.7716 | |
| 38 | 615.3136 | |
| 38 | 615.2655 | |
| 38 | 615.2244 | |
| 38 | 615.2243 | |
| 38 | 615.1776 | |
| 38 | 615.0907 | |
| 38 | 615.0807 | |
| 38 | 615.0444 | |
| 38 | 615.0522 | |
| 38 | 615.0303 | |
| 38 | 615.0201 | |
| 38 | 615.0102 | |
| 38 | 615.0018 | |
| 38 | 615.0008 | |
| 38 | 616.1212 | |
| 38 | 616.4545 | |
| 38 | 614.9997 | |
| 38 | 614.9929 | |
| 38 | 614.7899 | |
| 40 | 612.0106 | |
| 40 | 611.0082 | |
| 40 | 611.0007 | |
| 40 | 611.0001 | |
| 40 | 610.6844 | |
| 40 | 610.6663 | |
| 40 | 610.5516 | |
| 40 | 610.5004 | |
| 40 | 610.3323 | |
| 40 | 610.3024 | |
| 40 | 610.1447 | |
| 40 | 610.1201 | |
| 40 | 610.1161 | |
| 40 | 610.2021 | |
| 40 | 610.0202 | |
| 40 | 610.0099 | |
| 40 | 610.0175 | |
| 40 | 610.0002 | |
| 40 | 609.9997 | |
| 40 | 611.2888 |


Trending now
This is a popular solution!

Step by step
Solved in 2 steps with 1 images


