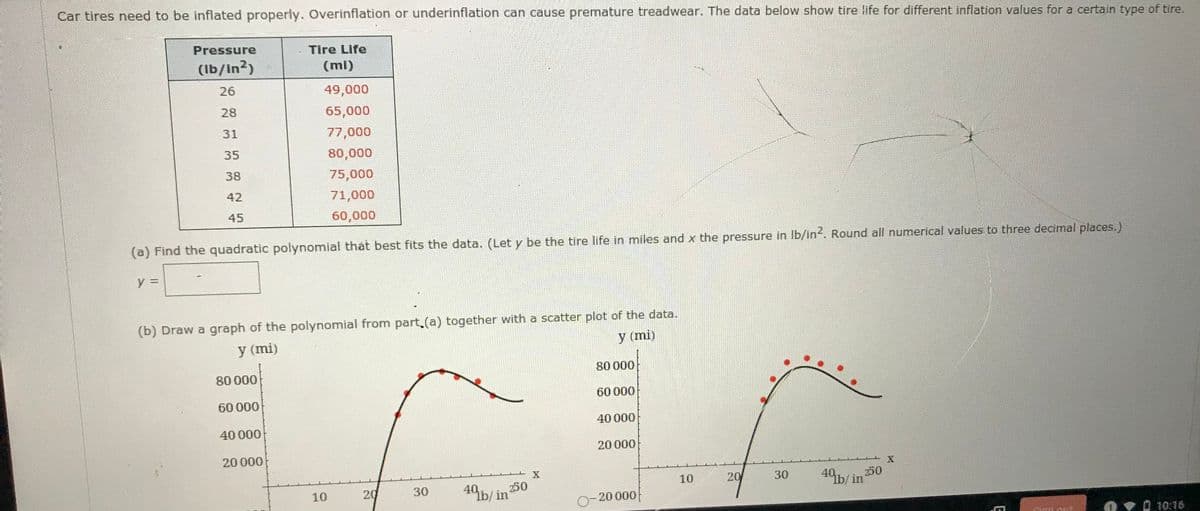
Car tires need to be inflated properly. Overinflation or underinflation can cause premature treadwear. The data below show tire life for different inflation values for a certain type of tire. Pressure Tire Life (Ib/In2) (mi) 26 49,000 28 65,000 31 77,000 35 ৪0,000 38 75,000 42 71,000 45 60,000 (a) Find the quadratic polynomial that best fits the data. (Let y be the tire life in miles and x the pressure in Ib/in. Round all numerical values to three decimal places.) y = Ecatter plot of the data.


Minimization
In mathematics, traditional optimization problems are typically expressed in terms of minimization. When we talk about minimizing or maximizing a function, we refer to the maximum and minimum possible values of that function. This can be expressed in terms of global or local range. The definition of minimization in the thesaurus is the process of reducing something to a small amount, value, or position. Minimization (noun) is an instance of belittling or disparagement.
Maxima and Minima
The extreme points of a function are the maximum and the minimum points of the function. A maximum is attained when the function takes the maximum value and a minimum is attained when the function takes the minimum value.
Derivatives
A derivative means a change. Geometrically it can be represented as a line with some steepness. Imagine climbing a mountain which is very steep and 500 meters high. Is it easier to climb? Definitely not! Suppose walking on the road for 500 meters. Which one would be easier? Walking on the road would be much easier than climbing a mountain.
Concavity
In calculus, concavity is a descriptor of mathematics that tells about the shape of the graph. It is the parameter that helps to estimate the maximum and minimum value of any of the functions and the concave nature using the graphical method. We use the first derivative test and second derivative test to understand the concave behavior of the function.


Trending now
This is a popular solution!

Step by step
Solved in 2 steps with 1 images


