CAR VALUE When trying to decide what car to buy, real value is not necessarily determined by how much you spend on the initial purchase. Instead, cars that are reliable and don't cost much to own often represent the best values. But, no matter how reliable or inexpensive a car may cost to own, it must also perform well. To measure value, Consumer Reports developed a statistic referred to as a value score. The value score is based upon five-year owner costs, overall road-test scores, and predicted linhilitu Octe ora hocad on the incurrad in the first
CAR VALUE When trying to decide what car to buy, real value is not necessarily determined by how much you spend on the initial purchase. Instead, cars that are reliable and don't cost much to own often represent the best values. But, no matter how reliable or inexpensive a car may cost to own, it must also perform well. To measure value, Consumer Reports developed a statistic referred to as a value score. The value score is based upon five-year owner costs, overall road-test scores, and predicted linhilitu Octe ora hocad on the incurrad in the first

MATLAB: An Introduction with Applications
6th Edition
ISBN:9781119256830
Author:Amos Gilat
Publisher:Amos Gilat
Chapter1: Starting With Matlab
Section: Chapter Questions
Problem 1P

Related questions
Question
100%
Case Problem #6: Finding the Best Car Value in Excel
Transcribed Image Text:CASE PROBLEM 4: FINDING THE BEST
CAR VALUE
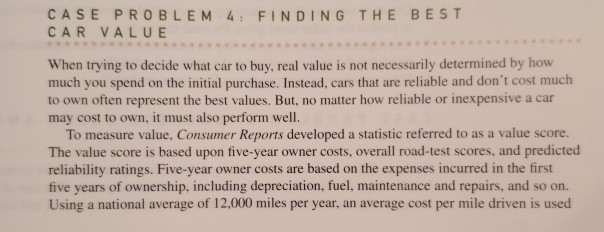
When trying to decide what car to buy, real value is not necessarily determined by how
much you spend on the initial purchase. Instead, cars that are reliable and don't cost much
to own often represent the best values. But, no matter how reliable or inexpensive a car
may cost to own, it must also perform well.
To measure value, Consumer Reports developed a statistic referred to as a value score.
The value score is based upon five-year owner costs, overall road-test scores, and predicted
reliability ratings. Five-year owner costs are based on the expenses incurred in the first
five years of ownership, including depreciation, fuel, maintenance and repairs, and so on.
Using a national average of 12,000 miles per year, an average cost per mile driven is used
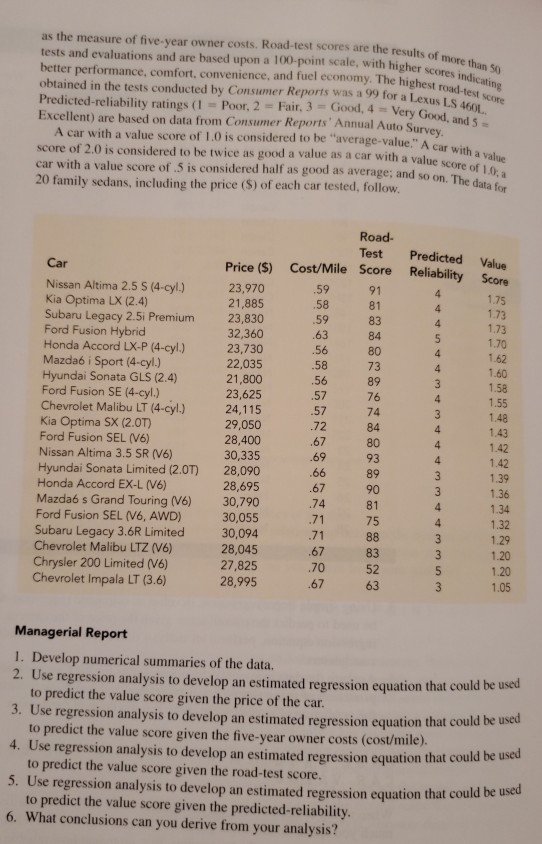
Transcribed Image Text:Poor, 2 Fair, 3 = Good, 4 Very Good, and 5=
A car with a value score of 1.0 is considered to be "average-value." A car with a value
as the measure of five-year owner costs. Road-test scores are the results of more than 50
tests and evaluations and are based upon a 100-point scale, with higher scores indicating
better performance, comfort, convenience, and fuel economy. The highest road-test score
score of 2,0 is considered to be twice as good a value as a car with a value score of 10, a
car with a value score of .5 is considered half as good as average; and so on. The data for
obtained in the tests conducted by Consumer Reports was a 99 for a Lexus LS A66
Predicted-reliability ratings (1 =
Excellent) are based on data from Consumer Reports' Annual Auto Survey
20 family sedans, including the price ($) of each car tested, follow,
Road-
Test
Predicted
Value
Car
Price ($) Cost/Mile Score
Reliability
Score
Nissan Altima 2.5 S (4-cyl.)
Kia Optima LX (2.4)
Subaru Legacy 2.5i Premium
Ford Fusion Hybrid
Honda Accord LX-P (4-cyl.)
Mazdaó i Sport (4-cyl.)
Hyundai Sonata GLS (2.4)
Ford Fusion SE (4-cyl.)
Chevrolet Malibu LT (4-cyl.)
Kia Optima SX (2.0T)
Ford Fusion SEL (V6)
Nissan Altima 3.5 SR (V6)
23,970
21,885
.59
91
4.
1.75
1.73
1.73
1.70
1.62
1.60
1.58
1.55
1.48
58
81
4.
23,830
32,360
23,730
22,035
21,800
23,625
.59
83
4.
.63
84
5.
.56
80
.58
73
4.
.56
89
3.
.57
76
4.
24,115
29,050
28,400
30,335
28,090
28,695
30,790
.57
74
.72
84
4.
1.43
1.42
.67
80
4.
.69
93
4
1.42
Hyundai Sonata Limited (2.0T)
Honda Accord EX-L (V6)
Mazda6 s Grand Touring (V6)
Ford Fusion SEL (V6, AWD)
Subaru Legacy 3.6R Limited
Chevrolet Malibu LTZ (V6)
.66
.67
89
1.39
90
1.36
.74
81
4
1.34
30,055
30,094
.71
75
4.
1.32
.71
88
1.29
28,045
27,825
28,995
.67
83
1.20
Chrysler 200 Limited (V6)
Chevrolet Impala LT (3.6)
.70
52
1.20
.67
63
1.05
Managerial Report
1. Develop numerical summaries of the data.
2. Use regression analysis to develop an estimated regression equation that could be used
to predict the value score given the price of the car.
3. Use regression analysis to develop an estimated regression equation that could be used
to predict the value score given the five-year owner costs (cost/mile).
4. Use regression analysis to develop an estimated regression equation that could be used
to predict the value score given the road-test score.
5. Use regression analysis to develop an estimated regression equation that could be usco
to predict the value score given the predicted-reliability.
6. What conclusions can you derive from your analysis?
t3353
Expert Solution
This question has been solved!
Explore an expertly crafted, step-by-step solution for a thorough understanding of key concepts.

This is a popular solution!

Trending now
This is a popular solution!

Step by step
Solved in 7 steps with 6 images

Recommended textbooks for you
MATLAB: An Introduction with Applications
Statistics
ISBN:
9781119256830
Author:
Amos Gilat
Publisher:
John Wiley & Sons Inc

Probability and Statistics for Engineering and th…
Statistics
ISBN:
9781305251809
Author:
Jay L. Devore
Publisher:
Cengage Learning

Statistics for The Behavioral Sciences (MindTap C…
Statistics
ISBN:
9781305504912
Author:
Frederick J Gravetter, Larry B. Wallnau
Publisher:
Cengage Learning
MATLAB: An Introduction with Applications
Statistics
ISBN:
9781119256830
Author:
Amos Gilat
Publisher:
John Wiley & Sons Inc
Probability and Statistics for Engineering and th…
Statistics
ISBN:
9781305251809
Author:
Jay L. Devore
Publisher:
Cengage Learning
Statistics for The Behavioral Sciences (MindTap C…
Statistics
ISBN:
9781305504912
Author:
Frederick J Gravetter, Larry B. Wallnau
Publisher:
Cengage Learning

Elementary Statistics: Picturing the World (7th E…
Statistics
ISBN:
9780134683416
Author:
Ron Larson, Betsy Farber
Publisher:
PEARSON

The Basic Practice of Statistics
Statistics
ISBN:
9781319042578
Author:
David S. Moore, William I. Notz, Michael A. Fligner
Publisher:
W. H. Freeman

Introduction to the Practice of Statistics
Statistics
ISBN:
9781319013387
Author:
David S. Moore, George P. McCabe, Bruce A. Craig
Publisher:
W. H. Freeman