Determine the point estimate of the population mean and margin error for the confidence interval. Lower bound is 16, upper bound is 26. The point estimate of the population mean is
Determine the point estimate of the population mean and margin error for the confidence interval. Lower bound is 16, upper bound is 26. The point estimate of the population mean is

Glencoe Algebra 1, Student Edition, 9780079039897, 0079039898, 2018
18th Edition
ISBN:9780079039897
Author:Carter
Publisher:Carter
Chapter10: Statistics
Section10.3: Measures Of Spread
Problem 1GP

Related questions
Question
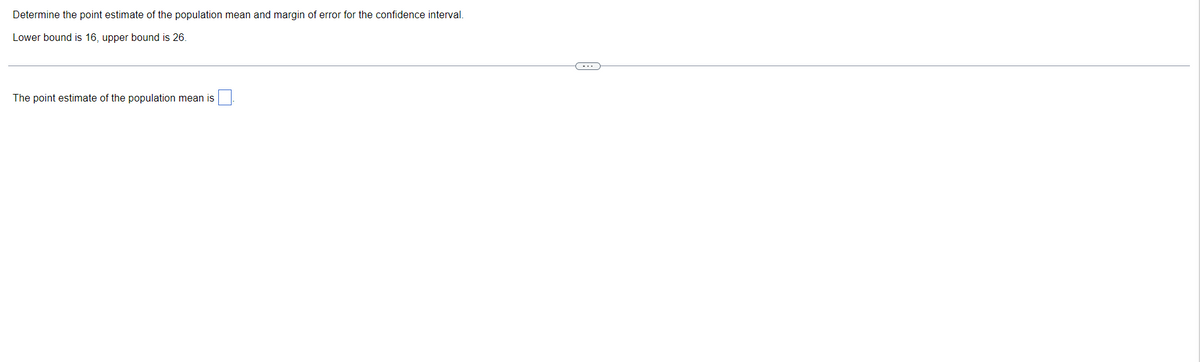
Transcribed Image Text:Determine the point estimate of the population mean and margin of error for the confidence interval.
Lower bound is 16, upper bound is 26.
The point estimate of the population mean is
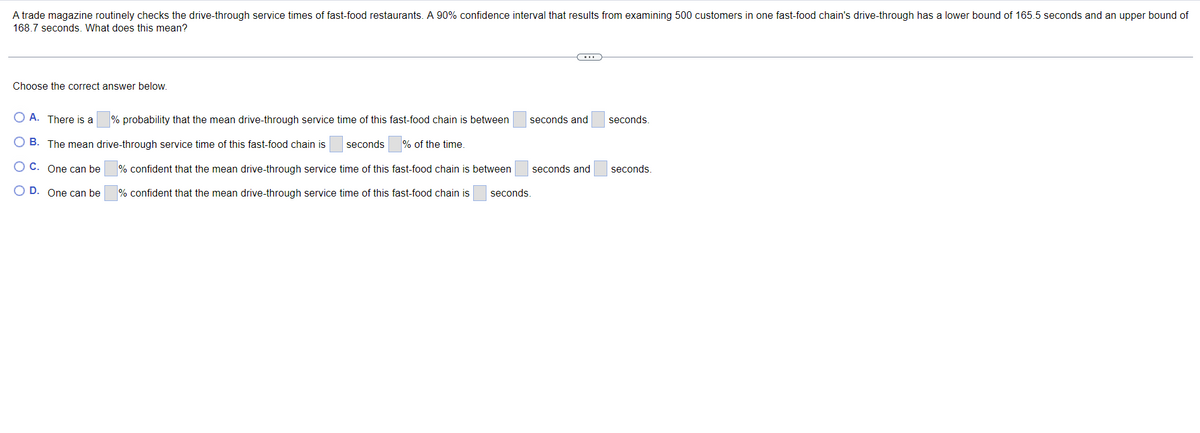
Transcribed Image Text:A trade magazine routinely checks the drive-through service times of fast-food restaurants. A 90% confidence interval that results from examining 500 customers in one fast-food chain's drive-through has a lower bound of 165.5 seconds and an upper bound of
168.7 seconds. What does this mean?
Choose the correct answer below.
O A. There is a
% probability that the mean drive-through service time of this fast-food chain is between
seconds and
seconds.
B.
The mean drive-through service time of this fast-food chain is
seconds
% of the time.
O C. One can be
% confident that the mean drive-through service time of this fast-food chain is between
seconds and
seconds
O D. One can be
% confident that the mean drive-through service time of this fast-food chain is
seconds.
Expert Solution
This question has been solved!
Explore an expertly crafted, step-by-step solution for a thorough understanding of key concepts.

This is a popular solution!

Trending now
This is a popular solution!

Step by step
Solved in 2 steps with 2 images

Recommended textbooks for you
Glencoe Algebra 1, Student Edition, 9780079039897…
Algebra
ISBN:
9780079039897
Author:
Carter
Publisher:
McGraw Hill
Glencoe Algebra 1, Student Edition, 9780079039897…
Algebra
ISBN:
9780079039897
Author:
Carter
Publisher:
McGraw Hill