Case Study 4: A car dealer wishes to learn whether they can predict customers preferred car make type based on suburb so that they could distribute their mail advertising more effectively. The table below shows the number of people in a random sample of 245 and their current cars. Suburb Nedlands Como Bentley Benz 20 15 BMW 30 20 15 Toyota 10 15 20 Hyundai 5 8 40 Kia 7 30 Your Tasks: Conduct an appropriate test to see if there is sufficient evidence to establish a connection between suburb and car preference at the 1% level of significance. Car Preference
Case Study 4: A car dealer wishes to learn whether they can predict customers preferred car make type based on suburb so that they could distribute their mail advertising more effectively. The table below shows the number of people in a random sample of 245 and their current cars. Suburb Nedlands Como Bentley Benz 20 15 BMW 30 20 15 Toyota 10 15 20 Hyundai 5 8 40 Kia 7 30 Your Tasks: Conduct an appropriate test to see if there is sufficient evidence to establish a connection between suburb and car preference at the 1% level of significance. Car Preference

Glencoe Algebra 1, Student Edition, 9780079039897, 0079039898, 2018
18th Edition
ISBN:9780079039897
Author:Carter
Publisher:Carter
Chapter4: Equations Of Linear Functions
Section: Chapter Questions
Problem 8SGR

Related questions

Question
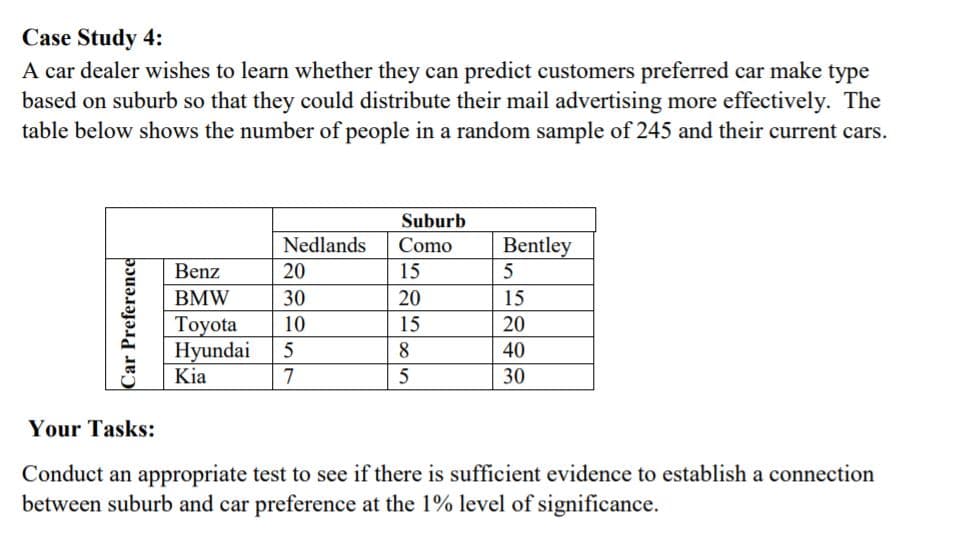
A car dealer wishes to learn whether they can predict customers preferred car make type
based on suburb so that they could distribute their mail advertising more effectively. The
table below shows the number of people in a random sample of 245 and their current cars.
Transcribed Image Text:Case Study 4:
A car dealer wishes to learn whether they can predict customers preferred car make type
based on suburb so that they could distribute their mail advertising more effectively. The
table below shows the number of people in a random sample of 245 and their current cars.
Suburb
Nedlands
Como
Bentley
5
Benz
20
15
BMW
30
20
15
Toyota
Hyundai
Kia
10
15
20
8.
40
7
5
30
Your Tasks:
Conduct an appropriate test to see if there is sufficient evidence to establish a connection
between suburb and car preference at the 1% level of significance.
Car Preference
Expert Solution
This question has been solved!
Explore an expertly crafted, step-by-step solution for a thorough understanding of key concepts.

This is a popular solution!

Trending now
This is a popular solution!

Step by step
Solved in 3 steps

Knowledge Booster


Learn more about
Need a deep-dive on the concept behind this application? Look no further. Learn more about this topic, statistics and related others by exploring similar questions and additional content below.Recommended textbooks for you
Glencoe Algebra 1, Student Edition, 9780079039897…
Algebra
ISBN:
9780079039897
Author:
Carter
Publisher:
McGraw Hill
Glencoe Algebra 1, Student Edition, 9780079039897…
Algebra
ISBN:
9780079039897
Author:
Carter
Publisher:
McGraw Hill