Choice DRUMS A B C D E 30 25 20 15 10 5 0 0 On the following graph, use the blue points (circle symbol) to plot Sam's initial production possibilities frontier (PPF). + Hours Producing (Cars) (Drums) 8 0 6 2 1 4 2 0 f 2 4 3 6 8 4 CARS Produced (Cars) (Drums) 4 0 3 11 2 16 1 0 5 19 6 20 7 8 Initial PPF New PPF
Choice DRUMS A B C D E 30 25 20 15 10 5 0 0 On the following graph, use the blue points (circle symbol) to plot Sam's initial production possibilities frontier (PPF). + Hours Producing (Cars) (Drums) 8 0 6 2 1 4 2 0 f 2 4 3 6 8 4 CARS Produced (Cars) (Drums) 4 0 3 11 2 16 1 0 5 19 6 20 7 8 Initial PPF New PPF

Economics Today and Tomorrow, Student Edition
1st Edition
ISBN:9780078747663
Author:McGraw-Hill
Publisher:McGraw-Hill
Chapter1: What Is Economics
Section: Chapter Questions
Problem 20AA

Related questions
Question
Transcribed Image Text:Homework (Ch 02)
Choice
DRUMS
ABCDE
30
25
20
10
5
0
0
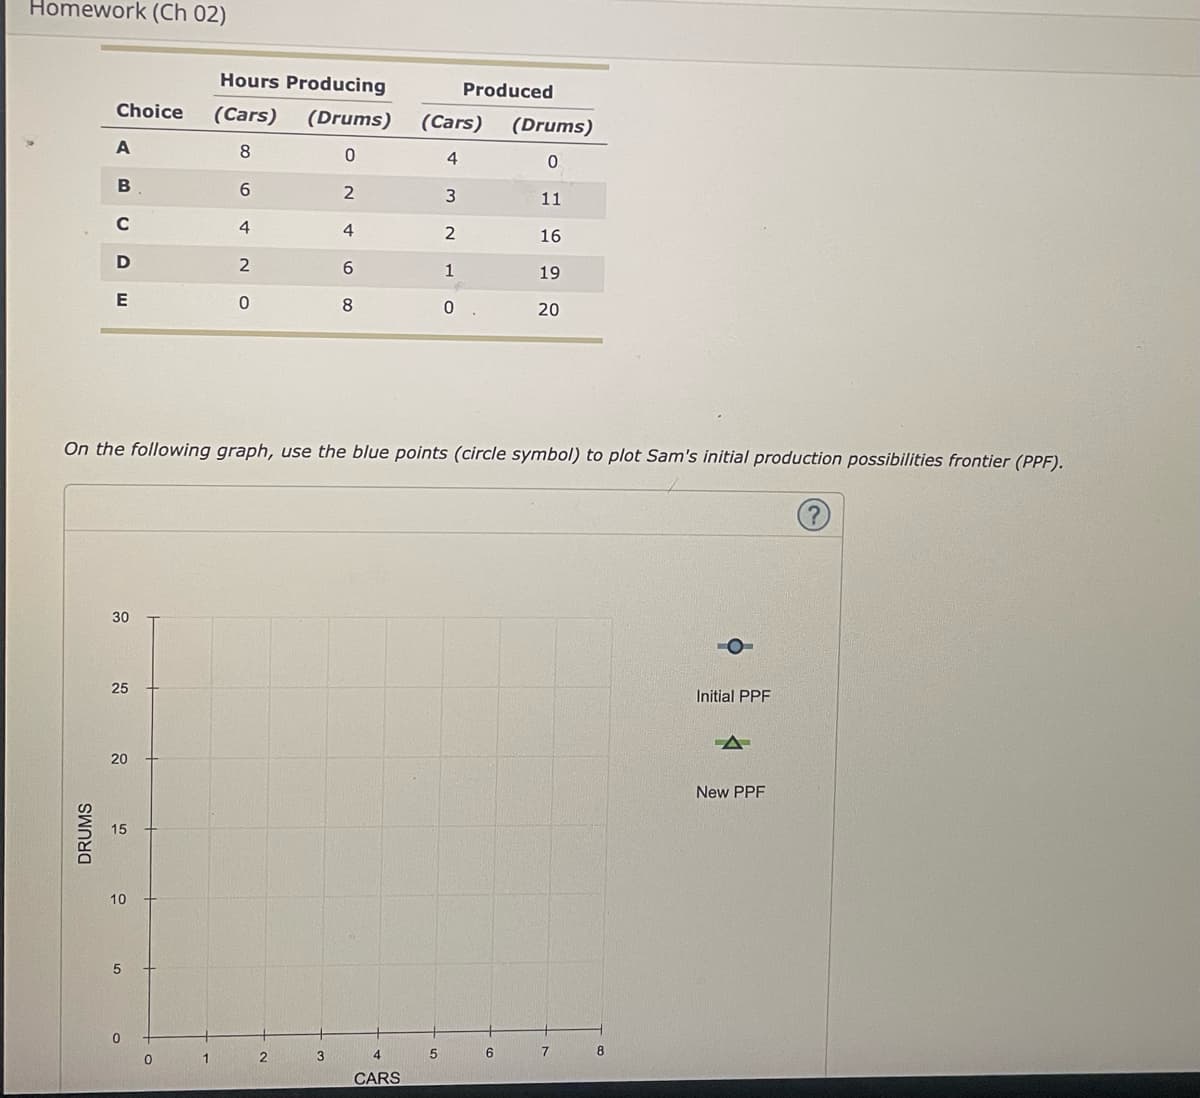
Hours Producing
(Cars)
(Drums)
8
0
6
2
1
4
2
0
On the following graph, use the blue points (circle symbol) to plot Sam's initial production possibilities frontier (PPF).
2
4
3
6
8
CARS
(Cars)
4
3
2
1
Produced
0
5
(Drums)
0
11
16
19
6
20
7
8
Initial PPF
(+
New PPF
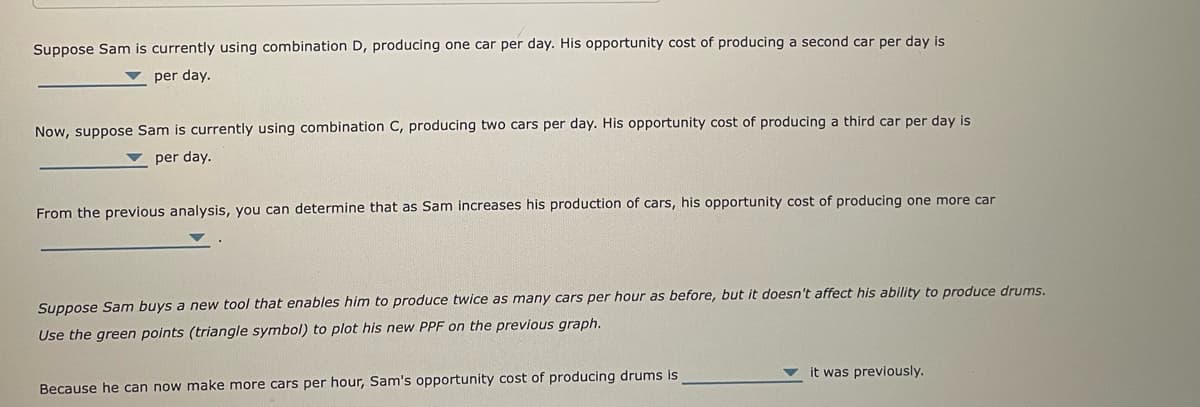
Transcribed Image Text:Suppose Sam is currently using combination D, producing one car per day. His opportunity cost of producing a second car per day is
per day.
Now, suppose Sam is currently using combination C, producing two cars per day. His opportunity cost of producing a third car per day is
per day.
From the previous analysis, you can determine that as Sam increases his production of cars, his opportunity cost of producing one more car
Suppose Sam buys a new tool that enables him to produce twice as many cars per hour as before, but it doesn't affect his ability to produce drums.
Use the green points (triangle symbol) to plot his new PPF on the previous graph.
Because he can now make more cars per hour, Sam's opportunity cost of producing drums is
it was previously.
Expert Solution
This question has been solved!
Explore an expertly crafted, step-by-step solution for a thorough understanding of key concepts.

Step by step
Solved in 2 steps with 2 images

Knowledge Booster


Learn more about
Need a deep-dive on the concept behind this application? Look no further. Learn more about this topic, economics and related others by exploring similar questions and additional content below.Recommended textbooks for you
Economics Today and Tomorrow, Student Edition
Economics
ISBN:
9780078747663
Author:
McGraw-Hill
Publisher:
Glencoe/McGraw-Hill School Pub Co


Economics Today and Tomorrow, Student Edition
Economics
ISBN:
9780078747663
Author:
McGraw-Hill
Publisher:
Glencoe/McGraw-Hill School Pub Co

