Choose one 'group' results (for example you may choose group 4 from cross 2), complete the Chi-square Analysis with ONLY that group's data. Fill in the table below to help you determine the statistical significance of your chi-square. (you'll need to make multiple copies of this table, and may need to add more rows) Expected Cross Observed Expected (E) O-E (O-E)? (O-E)?/E (0) Ratio Sum of (O-E)?/E:
Choose one 'group' results (for example you may choose group 4 from cross 2), complete the Chi-square Analysis with ONLY that group's data. Fill in the table below to help you determine the statistical significance of your chi-square. (you'll need to make multiple copies of this table, and may need to add more rows) Expected Cross Observed Expected (E) O-E (O-E)? (O-E)?/E (0) Ratio Sum of (O-E)?/E:

Chapter1: Relative Value, Addition, And Subtraction Of Decimals
Section: Chapter Questions
Problem 6SST

Related questions

Concept explainers
Question
please help with chart
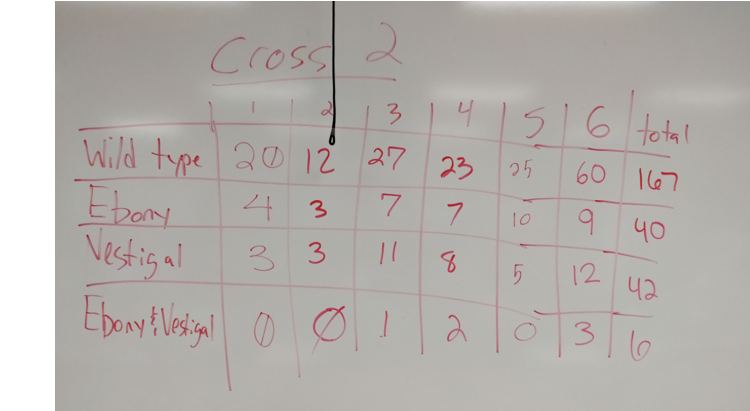
Transcribed Image Text:Cross 2
3
5 6 total
Wild type 20 12 27 23
Ebory
Vestig al
Ebony Alesial
25
60 167
7
9 40
3
10
3 3
12 42
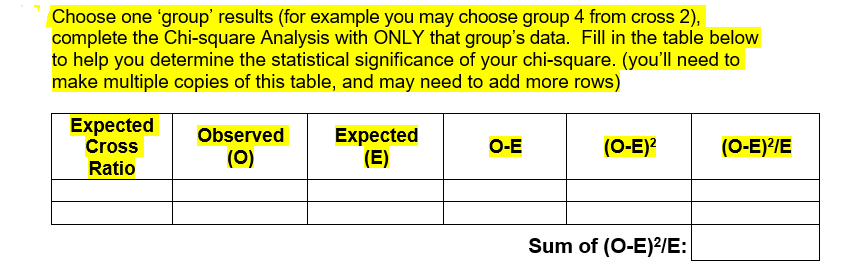
Transcribed Image Text:Choose one 'group' results (for example you may choose group 4 from cross 2),
complete the Chi-square Analysis with ONLY that group's data. Fill in the table below
to help you determine the statistical significance of your chi-square. (you'll need to
make multiple copies of this table, and may need to add more rows)
Expected
Observed
Expected
(E)
Cross
O-E
(0-E)?
(0-E)?/E
(0)
Ratio
Sum of (O-E)?/E:
Expert Solution
Step 1
Chi-square analysis is a simple test to determine if a hypothesis is true by quantifying the derivations expected by chance. The general convention is if the probability value is less than of 5%, the hypothesis is rejected. Chi square test was developed by Karl Pearson. It is the difference between observed and expected frequencies.
Characteristics of chi square test :
- The null hypothesis refers that chance alone cannot account for the differences between observed and expected data because there are several other factors also which affects.
- The null hypothesis refers that observed values are close enough to expected values.
- The lower the overall chi square value the more likely the null hypothesis be accepted.
- The higher the probability range associated with the overall chi square value ,the more likely null hypothesis will be rejected because if observed statistics is higher than critical value then null hypothesis will be rejected.

Trending now
This is a popular solution!

Step by step
Solved in 2 steps with 1 images

Knowledge Booster


Learn more about
Need a deep-dive on the concept behind this application? Look no further. Learn more about this topic, biology and related others by exploring similar questions and additional content below.Recommended textbooks for you

Biochemistry
Biochemistry
ISBN:
9781305577206
Author:
Reginald H. Garrett, Charles M. Grisham
Publisher:
Cengage Learning

Principles Of Radiographic Imaging: An Art And A …
Health & Nutrition
ISBN:
9781337711067
Author:
Richard R. Carlton, Arlene M. Adler, Vesna Balac
Publisher:
Cengage Learning