Choose the correct graph below. The following table compares fuel economy as calculated by car owners and by government standards. O A. O B. Car A Owner (x) Government (y) O 21.9 Ay 60 25.0 60- B 29.5 36.4 29.7 26.9 08 D 24.2 28.2 E 36.7 34.4 16.0 F 14.4 60 60 G 24.3 29.8 Oc. D. 15.5 15.3 Ay 60- 32.6 47.0 60+ a. Construct a scatter diagram to investigate the relationship between owner calculated mileage and government calculated mileage. b. Is there a relationship between the variables? Is it positive or negative? 60 b. Is there a relationship between the variables? Is it positive or negative? The relationship is negative because owner mileage is usually below the government mileage. The relationship is positive because as one variable increases, the other variable also tends to increase. The relationship is positive because owner mileage is almost exactly equal to government mileage. There is no relationship between the two variables. O O
Choose the correct graph below. The following table compares fuel economy as calculated by car owners and by government standards. O A. O B. Car A Owner (x) Government (y) O 21.9 Ay 60 25.0 60- B 29.5 36.4 29.7 26.9 08 D 24.2 28.2 E 36.7 34.4 16.0 F 14.4 60 60 G 24.3 29.8 Oc. D. 15.5 15.3 Ay 60- 32.6 47.0 60+ a. Construct a scatter diagram to investigate the relationship between owner calculated mileage and government calculated mileage. b. Is there a relationship between the variables? Is it positive or negative? 60 b. Is there a relationship between the variables? Is it positive or negative? The relationship is negative because owner mileage is usually below the government mileage. The relationship is positive because as one variable increases, the other variable also tends to increase. The relationship is positive because owner mileage is almost exactly equal to government mileage. There is no relationship between the two variables. O O

Glencoe Algebra 1, Student Edition, 9780079039897, 0079039898, 2018
18th Edition
ISBN:9780079039897
Author:Carter
Publisher:Carter
Chapter10: Statistics
Section10.2: Representing Data
Problem 5GP

Related questions
Question
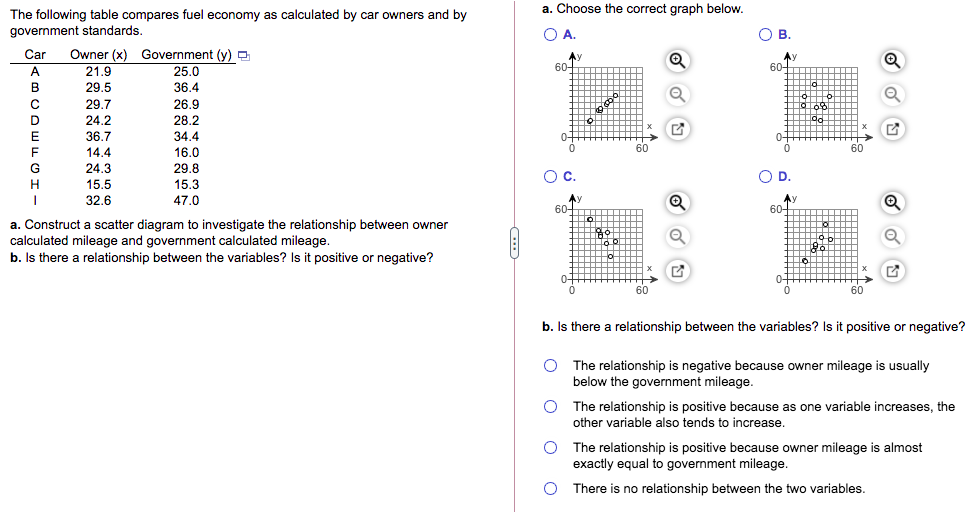
Transcribed Image Text:a. Choose the correct graph below.
The following table compares fuel economy as calculated by car owners and by
government standards.
O A.
OB.
Car
Owner (x) Government (y) O
Ay
60-
60-
A.
21.9
25.0
36.4
B
29.5
29.7
26.9
D
24.2
28.2
34.4
16.0
29.8
15.3
E
36.7
60
60
14.4
24.3
15.5
32.6
G
Oc.
47.0
Ay
60-
60-
a. Construct a scatter diagram to investigate the relationship between owner
calculated mileage and government calculated mileage.
b. Is there a relationship between the variables? Is it positive or negative?
60
60
b. Is there a relationship between the variables? Is it positive or negative?
O The relationship is negative because owner mileage is usually
below the government mileage.
The relationship is positive because as one variable increases, the
other variable also tends to increase.
The relationship is positive because owner mileage is almost
exactly equal to government mileage.
O There is no relationship between the two variables.
O O
Expert Solution
This question has been solved!
Explore an expertly crafted, step-by-step solution for a thorough understanding of key concepts.

Step by step
Solved in 2 steps with 2 images

Recommended textbooks for you
Glencoe Algebra 1, Student Edition, 9780079039897…
Algebra
ISBN:
9780079039897
Author:
Carter
Publisher:
McGraw Hill

Holt Mcdougal Larson Pre-algebra: Student Edition…
Algebra
ISBN:
9780547587776
Author:
HOLT MCDOUGAL
Publisher:
HOLT MCDOUGAL

College Algebra (MindTap Course List)
Algebra
ISBN:
9781305652231
Author:
R. David Gustafson, Jeff Hughes
Publisher:
Cengage Learning
Glencoe Algebra 1, Student Edition, 9780079039897…
Algebra
ISBN:
9780079039897
Author:
Carter
Publisher:
McGraw Hill
Holt Mcdougal Larson Pre-algebra: Student Edition…
Algebra
ISBN:
9780547587776
Author:
HOLT MCDOUGAL
Publisher:
HOLT MCDOUGAL
College Algebra (MindTap Course List)
Algebra
ISBN:
9781305652231
Author:
R. David Gustafson, Jeff Hughes
Publisher:
Cengage Learning

Functions and Change: A Modeling Approach to Coll…
Algebra
ISBN:
9781337111348
Author:
Bruce Crauder, Benny Evans, Alan Noell
Publisher:
Cengage Learning