Claim: The mean pulse rate (in beats per minute) of adult males is equal to 68.8 bpm. For a random sample of 144 adult males, the mean pulse rate is 69.3 bpm and the standard de bpm. Complete parts (a) and (b) below. Cu
Claim: The mean pulse rate (in beats per minute) of adult males is equal to 68.8 bpm. For a random sample of 144 adult males, the mean pulse rate is 69.3 bpm and the standard de bpm. Complete parts (a) and (b) below. Cu

Glencoe Algebra 1, Student Edition, 9780079039897, 0079039898, 2018
18th Edition
ISBN:9780079039897
Author:Carter
Publisher:Carter
Chapter10: Statistics
Section10.3: Measures Of Spread
Problem 16HP

Related questions
Question
100%
#33
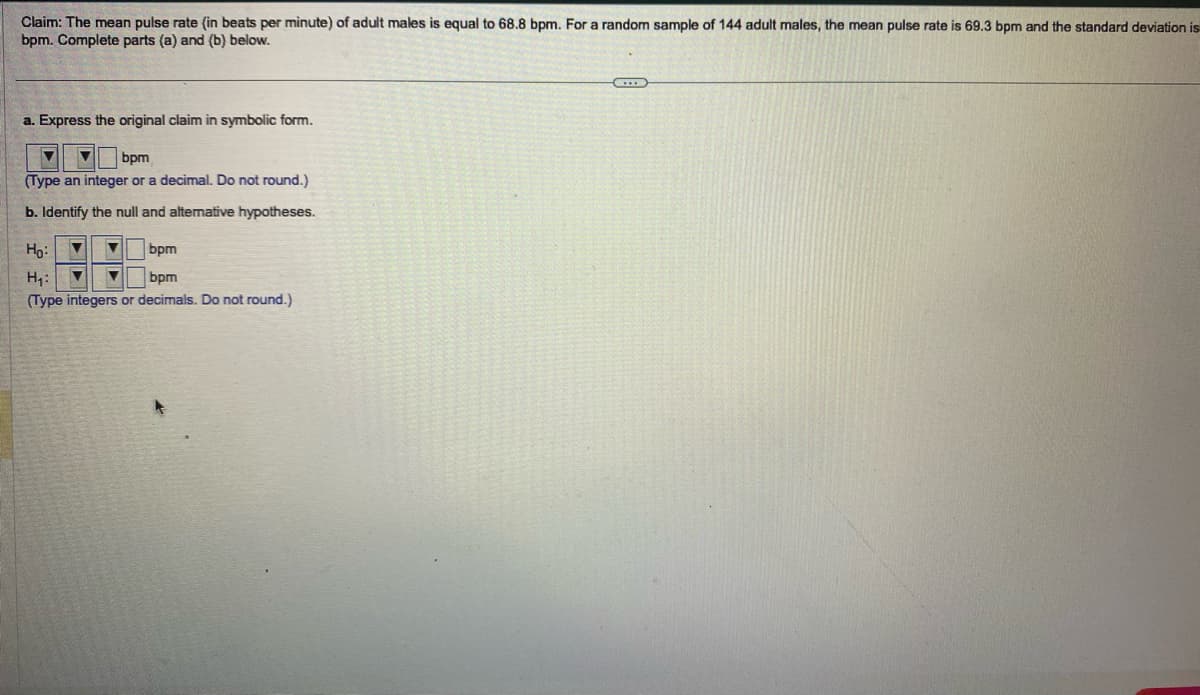
Transcribed Image Text:Claim: The mean pulse rate (in beats per minute) of adult males is equal to 68.8 bpm. For a random sample of 144 adult males, the mean pulse rate is 69.3 bpm and the standard deviation is
bpm. Complete parts (a) and (b) below.
a. Express the original claim in symbolic form.
▼ ▼
bpm
(Type an integer or a decimal. Do not round.)
b. Identify the null and alternative hypotheses.
Ho:
▼
bpm
H₁: ▼
bpm
(Type integers or decimals. Do not round.)
..
Expert Solution
This question has been solved!
Explore an expertly crafted, step-by-step solution for a thorough understanding of key concepts.

This is a popular solution!

Trending now
This is a popular solution!

Step by step
Solved in 2 steps

Recommended textbooks for you
Glencoe Algebra 1, Student Edition, 9780079039897…
Algebra
ISBN:
9780079039897
Author:
Carter
Publisher:
McGraw Hill
Glencoe Algebra 1, Student Edition, 9780079039897…
Algebra
ISBN:
9780079039897
Author:
Carter
Publisher:
McGraw Hill