
MATLAB: An Introduction with Applications
6th Edition
ISBN: 9781119256830
Author: Amos Gilat
Publisher: John Wiley & Sons Inc
expand_more
expand_more
format_list_bulleted
Related questions
Question
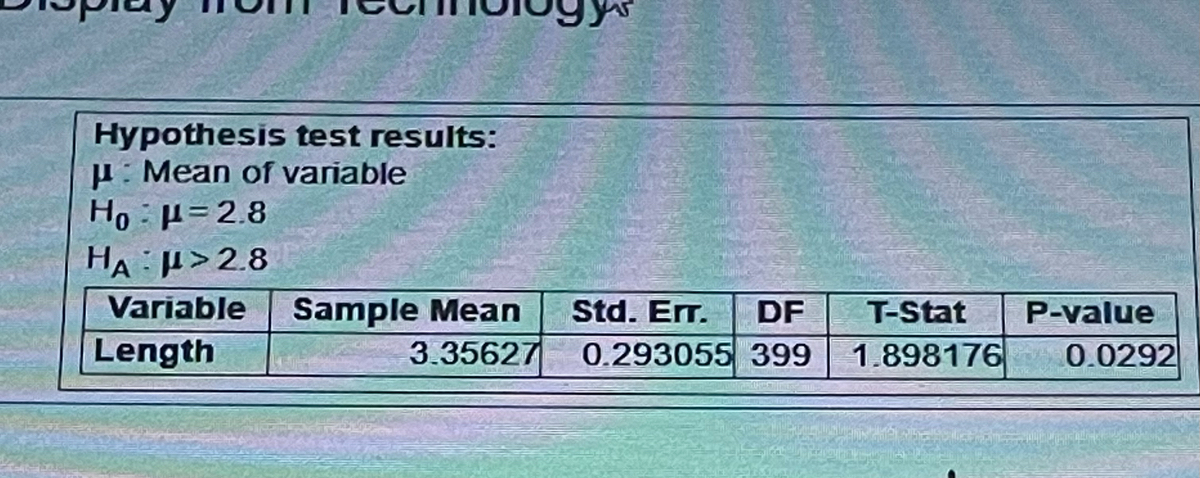

Transcribed Image Text:Hypothesis test results:
μ: Mean of variable
Ho - H=2.8
HA >2.8
Variable
Length
Sample Mean
3.35627
Std. Err. DF
0.293055 399
T-Stat
P-value
1.898176 0.0292

Transcribed Image Text:st
K
A data set includes data from 400 random tornadoes. The display from technology available below results from using the tornado lengths (miles) to test the
claim that the mean tornado length is greater than 2.8 miles. Use a 0.05 significance level. Identify the null and alternative hypotheses, test statistic, P-value,
and state the final conclusion that addresses the original claim.
iClick the icon to view the display from technology.
Identify the test statistic.
(Round to two decimal places as needed.).
Identify the P-value.
(Round to three decimal places as needed.)
State the final conclusion that addresses the original claim.
Reject
Ho. There is
sufficient evidence to support the claim that the mean tornado length is greater than 2.8 miles
Expert Solution
This question has been solved!
Explore an expertly crafted, step-by-step solution for a thorough understanding of key concepts.

This is a popular solution

Trending nowThis is a popular solution!

Step by stepSolved in 2 steps

Knowledge Booster

Similar questions
- Interpret the Type I and Type II Errors for the following claim, the mean average drinking age is greater than 18.arrow_forwardUse the following scenario to answer the next 6 questions. An engineer has designed a valve that will regulate water pressure on an automobile engine. The valve was tested on 30 engines and the mean pressure was 4.8 psi with a standard deviation of 1 psi. If the valve was designed to produce an overall mean pressure of 5.0 psi, is there sufficient evidence at the 10% level of significance that the valve performs below specifications? Choose the statement that matches your decision & conclusion. Group of answer choices Fail to reject the null: there is NOT sufficient evidence that the valve performs below specifications. Fail to reject the null: there IS sufficient evidence to conclude that the valve performs below specifications. Reject the null: there is NOT sufficient evidence that the valve performs below specifications. Reject the null: there IS sufficient evidence that the valve performs below specifications.arrow_forwardExplain the difference between a Type I error and a Type II error. Explain the connection between the significance level and a Type I error.arrow_forward
- Homeless Population Per State from 2010 to 2020 Source: https://www.usich.gov/homelessness-statistics State 2010 2020 Alabama 6046 3351 Alaska 1832 1949 Arizona 13711 10979 Arkansas 2762 2366 California 123480 161548 Colorado 15482 9846 Connecticut 4316 2905 DC 6539 6380 Delaware 982 1165 Florida 57551 27487 Georgia 19836 10234 Hawaii 5834 6458 Idaho 2346 2315 Illinois 14395 10431 Indiana 6452 5625 Iowa 3014 2647 Kansas 2024 2449 Kentucky 6623 4011 Louisiana 12482 3173 Maine 2379 2097 Maryland 10845 6360 Massachusetts 16646 17975 Michigan 13058 8638 Minnesota 7869 7940 Mississippi 2743 1107 Missouri 8122 6527 Montana 1615 1545 Nebraska 3877 2404 Nevada 11205 6900 New Hampshire 1574 1675 New Jersey 13737 9662 New Mexico 3475 3333 New York 65606 91271 North Carolina 12191 9280 North Dakota 799 541 Ohio 12569 10655 Oklahoma 5229 3932 Oregon 19492 14655 Pennsylvania 14516 13375 Rhode Island 1282 1104 South Carolina 4473 4287 South Dakota 731 1058 Tennessee 10276 7256 Texas 35121 27229 Utah…arrow_forwardHow do I find the Standard Deviation and Sample Mean?arrow_forwardHelp!arrow_forward
- Give: rejection region, test statistic, p-value, and conclusion please.arrow_forwardplease add excel formulas too.arrow_forwardYour friend claims that he heard that the average number of Facebook friends was 300 in 2010. You suspect that that the average has increased. 1. At the .05 significance level, what decision do you make? 2. Write a conclusion for your friend explaining your decision without using statistical symbols.arrow_forward
arrow_back_ios
SEE MORE QUESTIONS
arrow_forward_ios
Recommended textbooks for you
- MATLAB: An Introduction with ApplicationsStatisticsISBN:9781119256830Author:Amos GilatPublisher:John Wiley & Sons Inc
 Probability and Statistics for Engineering and th...StatisticsISBN:9781305251809Author:Jay L. DevorePublisher:Cengage Learning
 Statistics for The Behavioral Sciences (MindTap C...StatisticsISBN:9781305504912Author:Frederick J Gravetter, Larry B. WallnauPublisher:Cengage Learning
  Elementary Statistics: Picturing the World (7th E...StatisticsISBN:9780134683416Author:Ron Larson, Betsy FarberPublisher:PEARSON
 The Basic Practice of StatisticsStatisticsISBN:9781319042578Author:David S. Moore, William I. Notz, Michael A. FlignerPublisher:W. H. Freeman
 Introduction to the Practice of StatisticsStatisticsISBN:9781319013387Author:David S. Moore, George P. McCabe, Bruce A. CraigPublisher:W. H. Freeman
MATLAB: An Introduction with Applications
Statistics
ISBN:9781119256830
Author:Amos Gilat
Publisher:John Wiley & Sons Inc
Probability and Statistics for Engineering and th...
Statistics
ISBN:9781305251809
Author:Jay L. Devore
Publisher:Cengage Learning
Statistics for The Behavioral Sciences (MindTap C...
Statistics
ISBN:9781305504912
Author:Frederick J Gravetter, Larry B. Wallnau
Publisher:Cengage Learning
Elementary Statistics: Picturing the World (7th E...
Statistics
ISBN:9780134683416
Author:Ron Larson, Betsy Farber
Publisher:PEARSON
The Basic Practice of Statistics
Statistics
ISBN:9781319042578
Author:David S. Moore, William I. Notz, Michael A. Fligner
Publisher:W. H. Freeman
Introduction to the Practice of Statistics
Statistics
ISBN:9781319013387
Author:David S. Moore, George P. McCabe, Bruce A. Craig
Publisher:W. H. Freeman