clothing 600 verage FEB MAR Month The bar chart the amount of money spent monthly on food, gas and clothing for a family living in the USA in 2010. Overall, it can be seen that all levels of expenditure To begin, in January the | | over the period. money was spent on food, at approximately $500 per month. expenditure on food increased the following month, it then had a to be the lowest expenditure of all the items at the end of the period at just over $300.Gas appeared to follow the opposite pattern to food spending. It started lower at about $350 per month. The amount of money spent on gas then went down in the following month, but then it increased expenditure at the beginning of the period. The amount of money spent monthly on clothing fluctuated dramatically over the time frame. After reaching around to finish at just under $600 in April. Clothing, which at just over $200 in January, was considered the the same levels as food in February (nearly S600), it markedly in March, then to just under $700 in the final month. rose lowest most fell illustrates Although fall fluctuation slightly fluctuated dropped significantly
clothing 600 verage FEB MAR Month The bar chart the amount of money spent monthly on food, gas and clothing for a family living in the USA in 2010. Overall, it can be seen that all levels of expenditure To begin, in January the | | over the period. money was spent on food, at approximately $500 per month. expenditure on food increased the following month, it then had a to be the lowest expenditure of all the items at the end of the period at just over $300.Gas appeared to follow the opposite pattern to food spending. It started lower at about $350 per month. The amount of money spent on gas then went down in the following month, but then it increased expenditure at the beginning of the period. The amount of money spent monthly on clothing fluctuated dramatically over the time frame. After reaching around to finish at just under $600 in April. Clothing, which at just over $200 in January, was considered the the same levels as food in February (nearly S600), it markedly in March, then to just under $700 in the final month. rose lowest most fell illustrates Although fall fluctuation slightly fluctuated dropped significantly

Big Ideas Math A Bridge To Success Algebra 1: Student Edition 2015
1st Edition
ISBN:9781680331141
Author:HOUGHTON MIFFLIN HARCOURT
Publisher:HOUGHTON MIFFLIN HARCOURT
Chapter11: Data Analysis And Displays
Section11.4: Two-ways Tables
Problem 6E

Related questions

Topic Video
Question
Transcribed Image Text:n Part 1: Vocabulary Question
A moodle.nct.edu.om/mod/quiz/attempt.php?attempt=606335&cmid=64918
NCT e-Learning Portal Courses - Reports e-Services
- Academic Departments - ETC - CIMS -
Hadhram Ahmed Mohammed AI Hadhrami
Igas
clothing
600
average
400
200
JAN
FEB
MAR
APR
Month
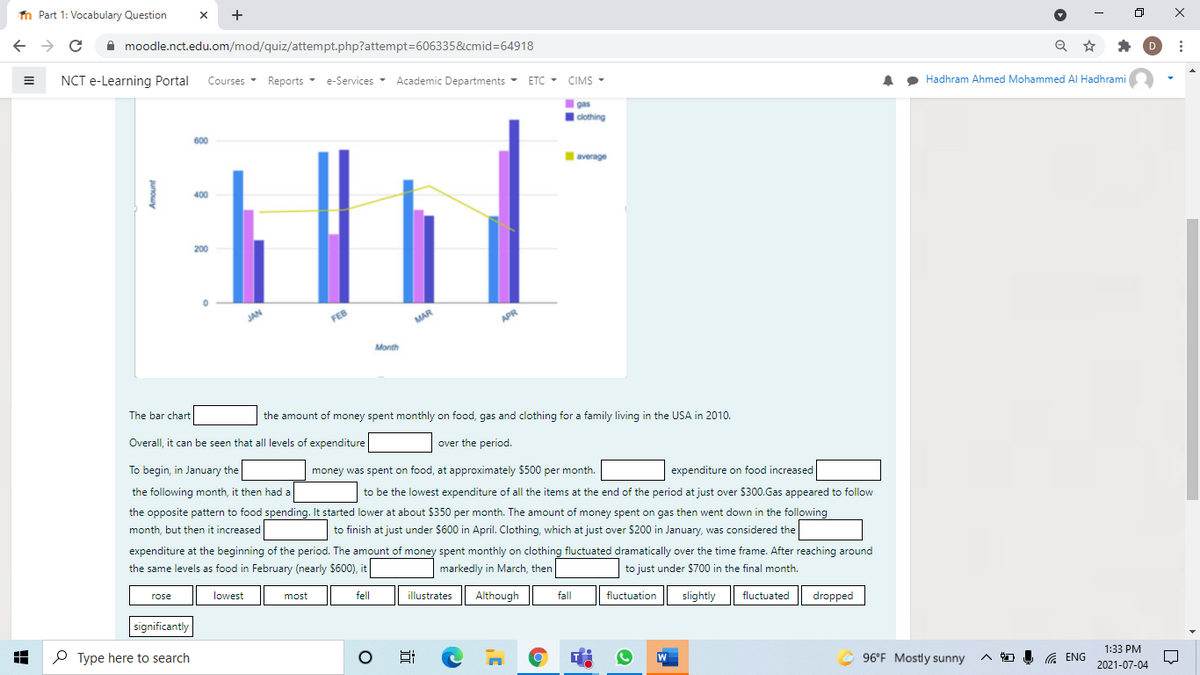
The bar chart
the amount of money spent monthly on food, gas and clothing for a family living in the USA in 2010.
Overall, it can be seen that all levels of expenditure
over the period.
To begin, in January the
money was spent on food, at approximately $500 per month.
expenditure on food increased
the following month, it then had a
to be the lowest expenditure of all the items at the end of the period at just over $300.Gas appeared to follow
the opposite pattern to food spending. It started lower at about $350 per month. The amount of money spent on gas then went down in the following
month, but then it increased
to finish at just under $600 in April. Clothing, which at just over $200 in January, was considered the
expenditure at the beginning of the period. The amount of money spent monthly on clothing fluctuated dramatically over the time frame. After reaching around
the same levels as food in February (nearly $600), it
markedly in March, then
to just under $700 in the final month.
rose
lowest
most
fell
illustrates
Although
fall
fluctuation
slightly
fluctuated
dropped
significantly
P Type here to search
W
96°F Mostly sunny
1:33 PM
a ENG
2021-07-04
近
Expert Solution
This question has been solved!
Explore an expertly crafted, step-by-step solution for a thorough understanding of key concepts.

Step by step
Solved in 2 steps

Knowledge Booster


Learn more about
Need a deep-dive on the concept behind this application? Look no further. Learn more about this topic, statistics and related others by exploring similar questions and additional content below.Recommended textbooks for you
Big Ideas Math A Bridge To Success Algebra 1: Stu…
Algebra
ISBN:
9781680331141
Author:
HOUGHTON MIFFLIN HARCOURT
Publisher:
Houghton Mifflin Harcourt
Big Ideas Math A Bridge To Success Algebra 1: Stu…
Algebra
ISBN:
9781680331141
Author:
HOUGHTON MIFFLIN HARCOURT
Publisher:
Houghton Mifflin Harcourt