Coastal State University is conducting a study regarding the possible relationship between the cumulative grade point average and the annual income of its recent graduates. A random sample of 147 Coastal State graduates from the last five years was selected, and it was found that the least-squares regression equation relating cumulative grade point average (denoted by x, on a 4-point scale) and annual income (denoted by y, in thousands of dollars) was y=37.79+5.51x. The standard error of the slope of this least-squares regression line was approximately 2.10. Test for a significant linear relationship between grade point average and annual income for the recent graduates of Coastal State by doing a hypothesis test regarding the population slope B1. (Assume that the variable y follows a normal distribution for each value of x and that the other regression assumptions are satisfied.) Use the 0.05 level of significance, and perform a two-tailed test. Then complete the parts below. (If necessary, consult a list of formulas.) (a) State the null hypothesis H and the alternative hypothesis H. H :0 H :0 D=0 OSO (b) Determine the type of test statistic to use. O20 O
Coastal State University is conducting a study regarding the possible relationship between the cumulative grade point average and the annual income of its recent graduates. A random sample of 147 Coastal State graduates from the last five years was selected, and it was found that the least-squares regression equation relating cumulative grade point average (denoted by x, on a 4-point scale) and annual income (denoted by y, in thousands of dollars) was y=37.79+5.51x. The standard error of the slope of this least-squares regression line was approximately 2.10. Test for a significant linear relationship between grade point average and annual income for the recent graduates of Coastal State by doing a hypothesis test regarding the population slope B1. (Assume that the variable y follows a normal distribution for each value of x and that the other regression assumptions are satisfied.) Use the 0.05 level of significance, and perform a two-tailed test. Then complete the parts below. (If necessary, consult a list of formulas.) (a) State the null hypothesis H and the alternative hypothesis H. H :0 H :0 D=0 OSO (b) Determine the type of test statistic to use. O20 O

Linear Algebra: A Modern Introduction
4th Edition
ISBN:9781285463247
Author:David Poole
Publisher:David Poole
Chapter7: Distance And Approximation
Section7.3: Least Squares Approximation
Problem 31EQ

Related questions
Question
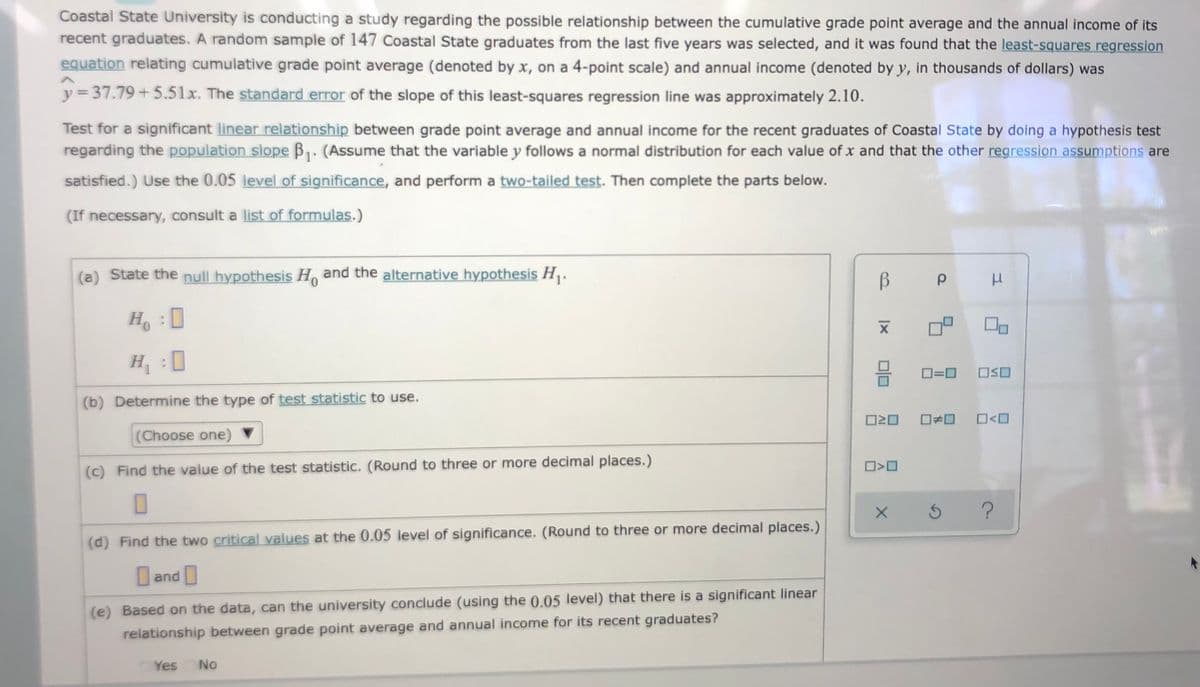
Transcribed Image Text:Coastal State University is conducting a study regarding the possible relationship between the cumulative grade point average and the annual income of its
recent graduates. A random sample of 147 Coastal State graduates from the last five years was selected, and it was found that the least-squares regression
equation relating cumulative grade point average (denoted by x, on a 4-point scale) and annual income (denoted by y, in thousands of dollars) was
y = 37.79+5.51x. The standard error of the slope of this least-squares regression line was approximately 2.10.
Test for a significant linear relationship between grade point average and annual income for the recent graduates of Coastal State by doing a hypothesis test
regarding the population slope B1. (Assume that the variable y follows a normal distribution for each value of x and that the other regression assumptions are
satisfied.) Use the 0.05 level of significance, and perform a two-tailed test. Then complete the parts below.
(If necessary, consult a list of formulas.)
(a) State the null hypothesis H and the alternative hypothesis H.
H :
H :0
OSO
(b) Determine the type of test statistic to use.
O20
O<O
(Choose one)
(c) Find the value of the test statistic. (Round to three or more decimal places.)
(d) Find the two critical values at the 0.05 level of significance. (Round to three or more decimal places.)
and
(e) Based on the data, can the university conclude (using the 0.05 level) that there is a significant linear
relationship between grade point average and annual income for its recent graduates?
Yes No
Expert Solution
This question has been solved!
Explore an expertly crafted, step-by-step solution for a thorough understanding of key concepts.

This is a popular solution!

Trending now
This is a popular solution!

Step by step
Solved in 2 steps with 2 images

Recommended textbooks for you
Linear Algebra: A Modern Introduction
Algebra
ISBN:
9781285463247
Author:
David Poole
Publisher:
Cengage Learning
Linear Algebra: A Modern Introduction
Algebra
ISBN:
9781285463247
Author:
David Poole
Publisher:
Cengage Learning