Is CEO compensation related to a company's performance? To test whether CEO compensation and a company's stock performance are related, a financial analyst collected data on 15 randomly selected, publicly traded companies. For each company, the analyst looked at two variables: the percent change in stock price over the past five years (which she denoted x) and the percent change in CEO compensation over the past five years (which she denoted y). For these 15 companies, the least-squares regression equation relating the two variables was y =-0.161 +0.039x, and the standard error of the slope of this least-squares regression line was approximately 0.018. Using her information, test for a significant linear relationship between these two variables by doing a hypothesis test regarding the population slope B.. (Assume that the variable y follows a normal distribution for each value of x and that the other regression assumptions are satisfied.) Use the 0.10 level of significance, and perform a two-tailed test. Then complete the parts below. (If necessary, consult a list of formulas,) (a) State the null hypothesis H, and the alternative hypothesis H,.
Is CEO compensation related to a company's performance? To test whether CEO compensation and a company's stock performance are related, a financial analyst collected data on 15 randomly selected, publicly traded companies. For each company, the analyst looked at two variables: the percent change in stock price over the past five years (which she denoted x) and the percent change in CEO compensation over the past five years (which she denoted y). For these 15 companies, the least-squares regression equation relating the two variables was y =-0.161 +0.039x, and the standard error of the slope of this least-squares regression line was approximately 0.018. Using her information, test for a significant linear relationship between these two variables by doing a hypothesis test regarding the population slope B.. (Assume that the variable y follows a normal distribution for each value of x and that the other regression assumptions are satisfied.) Use the 0.10 level of significance, and perform a two-tailed test. Then complete the parts below. (If necessary, consult a list of formulas,) (a) State the null hypothesis H, and the alternative hypothesis H,.

Glencoe Algebra 1, Student Edition, 9780079039897, 0079039898, 2018
18th Edition
ISBN:9780079039897
Author:Carter
Publisher:Carter
Chapter10: Statistics
Section10.6: Summarizing Categorical Data
Problem 23PPS

Related questions
Question
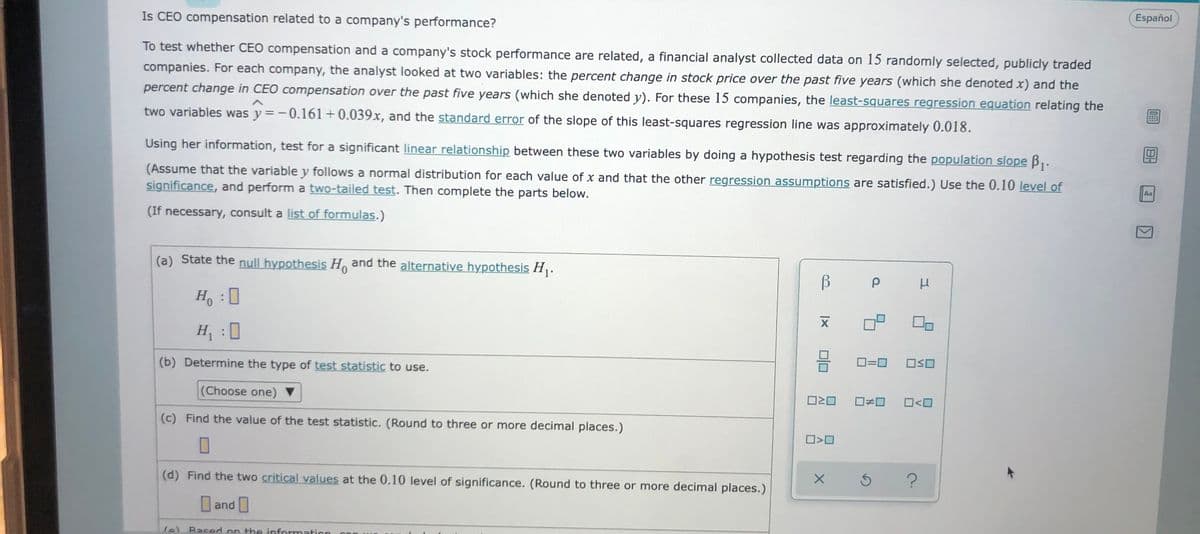
Transcribed Image Text:Is CEO compensation related to a company's performance?
Español
To test whether CEO compensation and a company's stock performance are related, a financial analyst collected data on 15 randomly selected, publicly traded
companies. For each company, the analyst looked at two variables: the percent change in stock price over the past five years (which she denoted x) and the
percent change in CEO compensation over the past five years (which she denoted y). For these 15 companies, the least-squares regression equation relating the
two variables was y =-0.161+0.039x, and the standard error of the slope of this least-squares regression line was approximately 0.018.
Using her information, test for a significant linear relationship between these two variables by doing a hypothesis test regarding the population slope B,.
(Assume that the variable y follows a normal distribution for each value of x and that the other regression assumptions are satisfied.) Use the 0.10 level of
significance, and perform a two-tailed test. Then complete the parts below.
Aa
(If necessary, consult a list of formulas.)
(a) State the null hypothesis H, and the alternative hypothesis H,.
H, :0
H
(b) Determine the type of test statistic to use.
O=0
(Choose one) ▼
O<O
(c) Find the value of the test statistic. (Round to three or more decimal places.)
(d) Find the two critical values at the 0.10 level of significance. (Round to three or more decimal places.)
and
fe) Based on the information
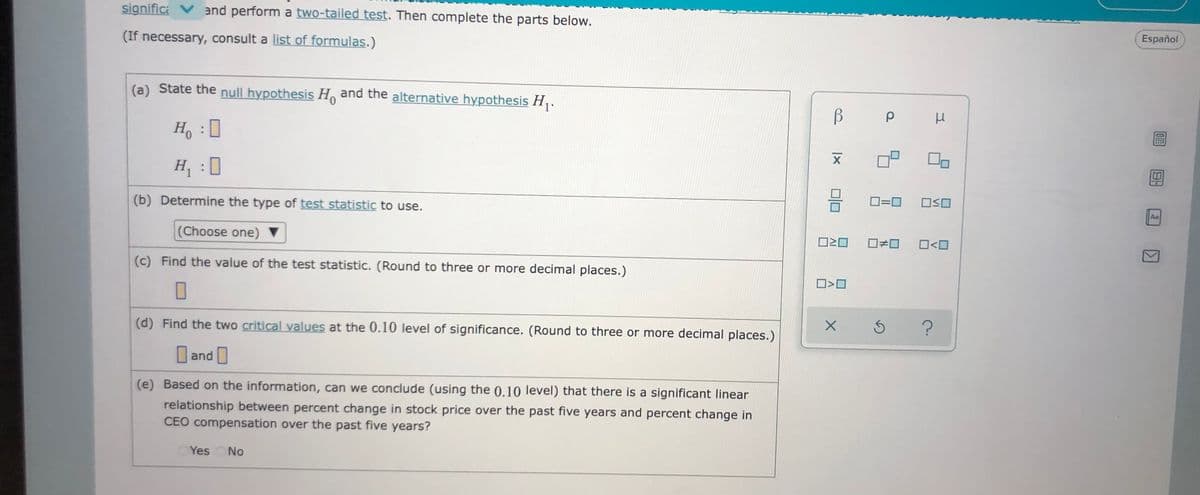
Transcribed Image Text:significa V and perform a two-tailed test. Then complete the parts below.
(If necessary, consult a list of formulas.)
Español
(a) State the null hypothesis H, and the alternative hypothesis H,.
H :
H :0
(b) Determine the type of test statistic to use.
D=0
OSO
Aa
(Choose one) ▼
O<O
(c) Find the value of the test statistic. (Round to three or more decimal places.)
(d) Find the two critical values at the 0.10 level of significance. (Round to three or more decimal places.)
I and I
(e) Based on the information, can we conclude (using the 0.10 level) that there is a significant linear
relationship between percent change in stock price over the past five years and percent change in
CEO compensation over the past five years?
Yes
No
Expert Solution
This question has been solved!
Explore an expertly crafted, step-by-step solution for a thorough understanding of key concepts.

This is a popular solution!

Trending now
This is a popular solution!

Step by step
Solved in 5 steps with 1 images

Recommended textbooks for you
Glencoe Algebra 1, Student Edition, 9780079039897…
Algebra
ISBN:
9780079039897
Author:
Carter
Publisher:
McGraw Hill

Big Ideas Math A Bridge To Success Algebra 1: Stu…
Algebra
ISBN:
9781680331141
Author:
HOUGHTON MIFFLIN HARCOURT
Publisher:
Houghton Mifflin Harcourt
Glencoe Algebra 1, Student Edition, 9780079039897…
Algebra
ISBN:
9780079039897
Author:
Carter
Publisher:
McGraw Hill
Big Ideas Math A Bridge To Success Algebra 1: Stu…
Algebra
ISBN:
9781680331141
Author:
HOUGHTON MIFFLIN HARCOURT
Publisher:
Houghton Mifflin Harcourt