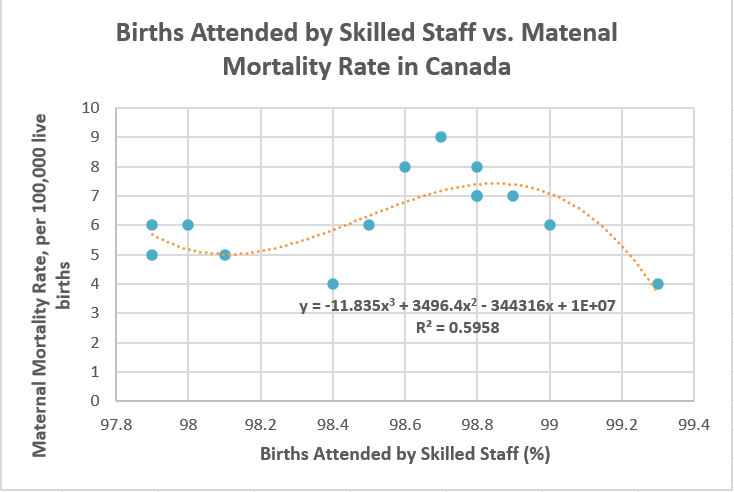
A student performed data analysis to determine the relationship between the births attended by skilled staff and the maternal mortality ratio in Brazil. The following is the curve that she generated. What can you say about the relationship of the two variables?


Q: Consider the distribution of the average number of hours that college students spend sleeping each…
A: The sample size is 18.
Q: The body temperatures of a group of healthy adults have a bell-shaped distribution with a mean of…
A: Given data in the problem is Mean=98.25 SD=0.68 (a) From the emperial third rule 99.7% of the data…
Q: Identify which of the following values are not valid numbers for a probability. 5 30%, 3₁ 330 25…
A: which of theses are not valid numbers for a probability? Select all that apply?
Q: ← Use the given confidence interval to find the margin of error and the sample proportion.…
A: Given that Confidence interval. (0.755 , 0.779)
Q: 21-B Book Street Books sells about 1040 books each month. The circle graph displays the most pop…
A: Here we are given that book Street books sell1040 each month. And, percentage of sports books is 16%…
Q: b. An excel analysis was applied to data collected from a random sample of 100 people in order to…
A: The provided information is as follows: SSRegression=141.77SSResidual=476.98N=100k=3Coefficient of…
Q: If you get a p-value of 1.2 what does that mean? O There is bias in the sample. O The sample mean is…
A: P-value = 1.2
Q: Your colleague investigates how prices of coffee vary with temperature. He wants to estimate the…
A: If the variable temp is measured in Fahrenheit and the same variable temp is measured in Celsius,…
Q: The accompanying data represent the total travel tax (in dollars) for a 3-day business trip in 8…
A: The sample size n is 8.
Q: A sociologist develops a test to measure attitudes about public transportation, and 27 randomly…
A: Given,sample size(n)=27sample mean(x¯)=76.2standard deviation(s)=21.4degrees of…
Q: 3 out of 20 tires are defective and 6 of them are randomly selected. What is the probability that…
A:
Q: Find the indicated probability by using the special addition rule. A relative frequency distribution…
A: Size Relative frequency 2 0.409 3 0.217 4 0.205 5 0.118 6 0.033…
Q: A state legislator wants to determine whether his voters' performance rating (0-100) has changed…
A:
Q: A manufacturing company designed a Factorial Experiment to determine whether the number of defective…
A: The level of significance is 0.05.
Q: Assume a member is selected at random from the population represented by the graph. Find the…
A: Given that the random variable X follows Normal distribution. Mean = μ = 270 Standard deviation =…
Q: A manufacturing company designed a Factorial Experiment to determine whether the number of defective…
A: Hypothesis for interaction effect in factorial designs H0: There is no intercation between the…
Q: A manufacturing company designed a Factorial Experiment to determine whether the number of defective…
A: Hypothesis for interactions effect in factorial designs H0: there is no interaction effect between…
Q: A study was conducted using 60 mobile network users, who volunteered to participate in the research…
A: Given: For Network A: n1 = 30 X1 = 8.2 s1 = 5.9 For Network B: n2 = 30 X2 = 5.6 s2 = 5.7 Formula…
Q: truct the 80% confidence interval for the difference p₁-P2 when x₁ = 40, n₁ = 80, x₂=20, and n₂ =…
A: Given X1=40 n1=80 X2=20 n2=60
Q: Suppose that X₁, X₂, X, are mutually independent random variables with the respective moment…
A: a) Given that Consider,
Q: Question 2 The Z-scores of an accepted range of Pizza Pockets is between -1.10 and 0.51. If there…
A: Probability is the measure calculated by various methods. One of such method is z score. When the…
Q: Listed below are amounts (in millions of dollars) collected from parking meters by a security…
A: Dear student, If you find this solution helpful please upvote ? it.
Q: Consider the following frequency table representing the distribution of hours students watch tv in…
A: Class Frequency 20-25 10 26-31 12 32-37 11 38-43 14 44-49 10…
Q: (a) Presented with "Heads or Tails", 118 out of 140 put Heads. Value = i Confidence interval: i…
A: The answers given in the steps below. Thanks!
Q: The lengths of adult males' hands are normally distributed with mean 186 mm and standard deviation…
A:
Q: What would be your decision concerning the null hypothesis?
A: From given data we have; sample size is n=40, The sample mean is x¯=33.5, The sample standard…
Q: Let X₁, X2, ..., X6 independent random variables with Geo (p) distribution. We also know that P(X₁ <…
A:
Q: The weights for 10 adults are 72, 78, 76, 86, 77, 77, 80, 77, 82, 80 kilograms. Determine the…
A:
Q: Gallup conducted a survey of 1,015 randomly selected U.S. adults about "Black Friday" shopping. They…
A: Suppose pM, pW are the true population proportions of men and women who planned to shop on the…
Q: amusement park studied methods for decreasing the waiting time (minutes) for rides by loading and…
A: cost ride_type metho 46 RC M1 48 RC M1 56 SD M1 48 SD M1 52 LF M1 48 LF M1 51 RC M2…
Q: margin of error = 0.025; confidence level = 95%; likely range=0.3 to 0.4 The required sample size is…
A: Given that Margin of error =E =0.025 95% confidence level.
Q: n 2010, shortly before a country's midterm elections, people in that country were dissatisfied…
A: Given: 59% of adults in the country thought that a third major party was needed; p=0.59 62% of…
Q: . The sample proportion is enter your response here. (Round to two decimal places as needed.) Part…
A: Given: sample size(n)=1015number of success(x)=548
Q: (b) Compute 95% confidence interval for o. Note: 20.025 = 1.96.
A:
Q: f you have two samples with the same sample mean but different sample sizes, what would you expect…
A: From the given information we find the correct Option regarding confidence interval.
Q: The annual salary for one particular occupation is normally distributed, with a mean of about…
A: Suppose the random variable X defines the annual salary for one particular occupation.
Q: 2. Suppose that Yt follows the stationary AR (1) model Yt=2.5+0.7Yt−1+ϵt, where…
A: " Since you have posted a question with multiple sub-parts, we will solve the first three subparts…
Q: Fill in the blank. The states that if, under a given assumption, the probability of a particular…
A: Given data To fill in the blank The ____states that if under a given assumption the probability of…
Q: whether using the one-proporti one-proportion z priate, use the = level.
A: Given: n=50 X=8 α=1-0.98=0.02
Q: The next three problems are based on the following scenario. A small country with three states (A,…
A: Given , population of A=733 Total population=733+351+416 Total population=1500 No. Of…
Q: Question 2 David set a mathematics quiz for his students. The quiz is marked out of 10. His…
A:
Q: 348 homes in Oregon found that 156 were heated by natural gas. Test the claim that proportion of…
A:
Q: The highway department is testing two types of reflecting paint for concrete bridge end pillars. The…
A: Given: Significance level α = 1% = 0.01 For Orange Paint: n1 = 12 X1 = 9.4 s1 = 2.4 For Yellow…
Q: For a sample of 297 students, it was found that 71 of the students liked online classes. What is the…
A: According to the given information in this question We need to find the value of best point estimate…
Q: Given values of x and y, the correlation has a. very strong relationship. b. very strong negative…
A: Given: X Y 3 4 2 5 1 8 4 4 6 2
Q: Consider a uniform distribution from a = 2 to b = 29. (a) Find the probability that x lies between 6…
A: Given data,Consider a uniform distribution froma=2b=29
Q: Let p be the population proportion for the following condition. Find the point esti A study of 4344…
A: A study of 4344 adults from country A; n=4344 2301 think mainstream media is more interested in…
Q: The probability distribution of a discrete random variable X is given below. Value X of X P (X=x) -4…
A: Cumulative value is calculated by adding the preceding values. Cumulative distribution explains the…
Q: Data on the cost (millions of dollars) and the running time (minutes) for films of a particular…
A:
Q: In a survey 1100 residents of London, 737 said they would carry a COVID passport. Test the claim…
A: Givenx=737n=1100α=0.05claim is that the percentage of london residents who would carry a…
A student performed data analysis to determine the relationship between the births attended by skilled staff and the maternal mortality ratio in Brazil. The following is the curve that she generated. What can you say about the relationship of the two variables?

Step by step
Solved in 2 steps

- 10) Integrated circuits consist of electric channels that are etched onto silicon wafers. A certain proportion of circuits are defective because of "undercutting", which occurs when too much material is etched away so that the channels, which consist of the unetched portions of the wafers, are too narrow. A redesigned process, involving lower pressure in the etching chamber, is being investigated. The goal is to reduce the rate of undercutting to less than 5%. Out of the first 1000 circuits manufactured by the new process, only 32 show evidence of undercutting. If someone asks you the question "Can you conclude that the goal has been met?", what is the p-value that you'll report? Round the answer to four decimal places.In a certain jurisdiction, all students in Grade Three are required to take a standardized test to evaluate their math comprehension skills.The file contains these data resulting from a random sample of n=30 schools within this jurisdiction. From these data you wish to estimate the model Yi=β0+β1Xi+ei where Xi is the percentage of Grade Three students in School i who live below the poverty line and Yi is the average mathematics comprehension score for all Grade Three students in the same school, School i. The observed data for the X variable is labled perbelowpoverty and the observed data for the Y variable is labeled mathscore in the file.Import (either hand type or load the file) data into R Studio, then answer the following questions based on the data.(a) Create a scatterplot of the data. What can you say about the nature of the relationship between the percentage of Grade Three students living below the poverty line in a certain school and the school's average Grade Three…Determine if one-tailed test or two-tailed test fits the given alternative hypothesis. 1. Rexidol and Alaxan FR have the same rate of time of reducing the body pain of patients. Answer: 2. The mean weight of Grade 11 students is less than 55 kilograms. Answer: 3. The enrolment rate of the Elementary school department and secondary school department of ingenium school marikina is not the same. Answer: 4. Male students of an Institution have a higher quotient level of intelligence compare to Female students of the same Institution. Answer: 5. The mean of internet users this year is significantly higher as compared to last year. Answer: (Just put short explanation)
- In a certain jurisdiction, all students in Grade Three are required to take a standardized test to evaluate their math comprehension skills.The attached contains these data resulting from a random sample of n=40 schools within this jurisdiction. From these data you wish to estimate the model Yi=β0+β1Xi+ei where Xi is the percentage of Grade Three students in School i who live below the poverty line and Yi is the average mathematics comprehension score for all Grade Three students in the same school, School i. The observed data for the X variable is labled perbelowpoverty and the obvserved data for the Y variable is labeled mathscore in the .csv file.Import (either hand type or load the file) data into R Studio, then answer the following questions based on the data.(a) Create a scatterplot of the data. What can you say about the nature of the relationship between the percentage of Grade Three students living below the poverty line in a certain school and the school's average Grade Three…The records of a state-owned company indicate that of all vehicles undergoing emissions testing during the previous year, 70% passed on the first test. A random sample of 200 cars tested in the country during the current year reveals that 62% passed the initial test. Does this data suggest that the true proportion for this country is less than the previous countrywide proportion? Test the relevant hypothesis at the 5% level of significance. (d) Determine the critical region(s) for this test. (e) State the conclusion of this test. Give a reason for your answer.How do I construct a time series plot and determine pattern of data? What formula do I use for regression analysis to find the parameters for the line that minimizes MSE for this time series?
- IVP mean initial value problemTrue or false: a) When a process is in a state of statistical control, then most of the output will meet specifications. b) When a process is out of control, an unacceptably large proportion of the output will not meet specifications. c) When a process is in a state of statistical control, all the variation in the process is due to causes that are inherent in the process itself. d) When a process is out of control, some of the variation in the process is due to causes that are outside of the process.At noon time, customers arrive at Metrobank counter managed by a single cashier with mean arrival rate of 6 customers per hour. The cashier attends the customers on first come first served basis at 10 customers per hour.What is the waiting time of a customer in the system?
- Incidence rate in the last influenza epidemic was found to be 50 per thousand (5%) of the population exposed. What should be the size of sample to find incidence rate in the current epidemic if allowable error is 0.005 and 0.01?3.) a chi square test has been used to test the relationship between gender and support for abortion. The null hypothesis has been rejected. What may be concluded? a. gender and support for abortion are not related b. support for abortion depends on gender c. females are more supportive of abortion d. males are more supportive of abortion 4.) if the distribution of the scores of one variable changes across the values of another variable, the variables: a. are associated to some extend b. have a statistically significant realtionship c. have a cause and effect relationship d. are perfectly associatedStrands of human hair absorb elements from the bloodstream and provide a historical record of both health and the use or nonuse of chemical substances. Hair grows at the rate of about one – half inch per month, and a person with long hair might be accused or absolved on the basis of a segment of hair that sprouted many months or years ago. By separately analyzing sections of the hair strand, scientists can even approximate the periods of time during which drug use was heavy, moderate, light or altogether absent. If a transit employee provides a strand of hair for drug testing, state the null and alternative hypothesis in verbal terms, then identify what would constitute a Type I error and Type II error in this situation.
