Colorful Tile, Inc., is a rapidly growing chain of ceramic tile outlets that caters to the do-it-yourself home remodeling market. In 2020, 33 stores were operated in small to medium-size metropolitan markets. An in-house study of sales by these outlets revealed the following (standard errors or standard deviations are in parentheses) Q = 4 – 5P+ 2A + 0.21 + 0.25HF (3) (1.8) (0.7) (0.1) (0.1) R² = 0.93, standard error of the estimate (SEE) = 6 Austin, Texas, was a typical market covered by this analysis. During 2020 in the Austin market, price (P) was $5, advertising (A) was $30,000, income (I) was an average S55,000 per household, and the number of household formations (HF) was 4000. Calculate and interpret the relevant advertising point elasticity. Here, Q is tile sales (in thousands of cases), P is tile price (per case), A is advertising expenditures (in thousands of dollars), I is disposable income per household (in thousands of dollars), and HF is household formation (in hundreds). 2 Given the values of the independent variables in part E above, give a point estimate and an interval estimate of Q with 95% confidence level. Assume that the preceding model and data are relevant for the coming period. Estimate the 30 probability that the Austin store will make a profit during 2021 if total costs are projected to be $300000.
Colorful Tile, Inc., is a rapidly growing chain of ceramic tile outlets that caters to the do-it-yourself home remodeling market. In 2020, 33 stores were operated in small to medium-size metropolitan markets. An in-house study of sales by these outlets revealed the following (standard errors or standard deviations are in parentheses) Q = 4 – 5P+ 2A + 0.21 + 0.25HF (3) (1.8) (0.7) (0.1) (0.1) R² = 0.93, standard error of the estimate (SEE) = 6 Austin, Texas, was a typical market covered by this analysis. During 2020 in the Austin market, price (P) was $5, advertising (A) was $30,000, income (I) was an average S55,000 per household, and the number of household formations (HF) was 4000. Calculate and interpret the relevant advertising point elasticity. Here, Q is tile sales (in thousands of cases), P is tile price (per case), A is advertising expenditures (in thousands of dollars), I is disposable income per household (in thousands of dollars), and HF is household formation (in hundreds). 2 Given the values of the independent variables in part E above, give a point estimate and an interval estimate of Q with 95% confidence level. Assume that the preceding model and data are relevant for the coming period. Estimate the 30 probability that the Austin store will make a profit during 2021 if total costs are projected to be $300000.

Chapter1: Making Economics Decisions
Section: Chapter Questions
Problem 1QTC

Related questions

Question
Please find the 3 questions
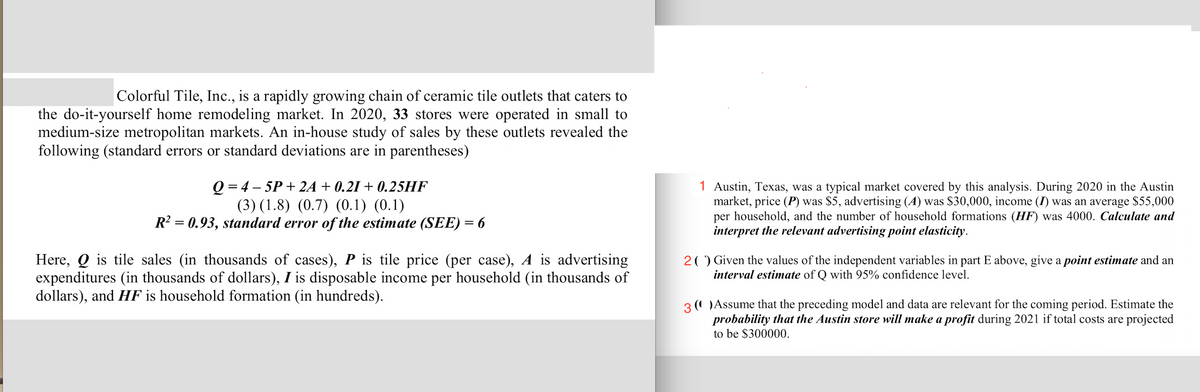
Transcribed Image Text:Colorful Tile, Inc., is a rapidly growing chain of ceramic tile outlets that caters to
the do-it-yourself home remodeling market. In 2020, 33 stores were operated in small to
medium-size metropolitan markets. An in-house study of sales by these outlets revealed the
following (standard errors or standard deviations are in parentheses)
Q = 4 – 5P + 2A + 0.21 + 0.25HF
(3) (1.8) (0.7) (0.1) (0.1)
R? = 0.93, standard error of the estimate (SEE) = 6
1 Austin, Texas, was a typical market covered by this analysis. During 2020 in the Austin
market, price (P) was $5, advertising (A) was $30,000, income (I) was an average $55,000
per household, and the number of household formations (HF) was 4000. Calculate and
interpret the relevant advertising point elasticity.
Here, Q is tile sales (in thousands of cases), P is tile price (per case), A is advertising
expenditures (in thousands of dollars), I is disposable income per household (in thousands of
dollars), and HF is household formation (in hundreds).
20) Given the values of the independent variables in part E above, give a point estimate and an
interval estimate of Q with 95% confidence level.
Assume that the preceding model and data are relevant for the coming period. Estimate the
3
probability that the Austin store will make a profit during 2021 if total costs are projected
to be $300000.
Expert Solution
This question has been solved!
Explore an expertly crafted, step-by-step solution for a thorough understanding of key concepts.

Step by step
Solved in 2 steps

Knowledge Booster


Learn more about
Need a deep-dive on the concept behind this application? Look no further. Learn more about this topic, economics and related others by exploring similar questions and additional content below.Recommended textbooks for you

Principles of Economics (12th Edition)
Economics
ISBN:
9780134078779
Author:
Karl E. Case, Ray C. Fair, Sharon E. Oster
Publisher:
PEARSON

Engineering Economy (17th Edition)
Economics
ISBN:
9780134870069
Author:
William G. Sullivan, Elin M. Wicks, C. Patrick Koelling
Publisher:
PEARSON
Principles of Economics (12th Edition)
Economics
ISBN:
9780134078779
Author:
Karl E. Case, Ray C. Fair, Sharon E. Oster
Publisher:
PEARSON
Engineering Economy (17th Edition)
Economics
ISBN:
9780134870069
Author:
William G. Sullivan, Elin M. Wicks, C. Patrick Koelling
Publisher:
PEARSON

Principles of Economics (MindTap Course List)
Economics
ISBN:
9781305585126
Author:
N. Gregory Mankiw
Publisher:
Cengage Learning

Managerial Economics: A Problem Solving Approach
Economics
ISBN:
9781337106665
Author:
Luke M. Froeb, Brian T. McCann, Michael R. Ward, Mike Shor
Publisher:
Cengage Learning

Managerial Economics & Business Strategy (Mcgraw-…
Economics
ISBN:
9781259290619
Author:
Michael Baye, Jeff Prince
Publisher:
McGraw-Hill Education