comes for childcare workers in Pennsylvania ane e of childcare workers in the state of Pennsylvan ced a random sample of 15 childcare workers fra report their mean annual income. The data obta Annual income in dollars 2, 46584, 54266, 53218, 56269, 52335, 53235, 6, 56638, 45390, 54321, 48214, 44924, 38383,
comes for childcare workers in Pennsylvania ane e of childcare workers in the state of Pennsylvan ced a random sample of 15 childcare workers fra report their mean annual income. The data obta Annual income in dollars 2, 46584, 54266, 53218, 56269, 52335, 53235, 6, 56638, 45390, 54321, 48214, 44924, 38383,

Holt Mcdougal Larson Pre-algebra: Student Edition 2012
1st Edition
ISBN:9780547587776
Author:HOLT MCDOUGAL
Publisher:HOLT MCDOUGAL
Chapter11: Data Analysis And Probability
Section11.4: Collecting Data
Problem 5E

Related questions
Topic Video
Question
Carry your intermediate computations to at least three decimal places. (If necessary, consult a list of formulas.)
|
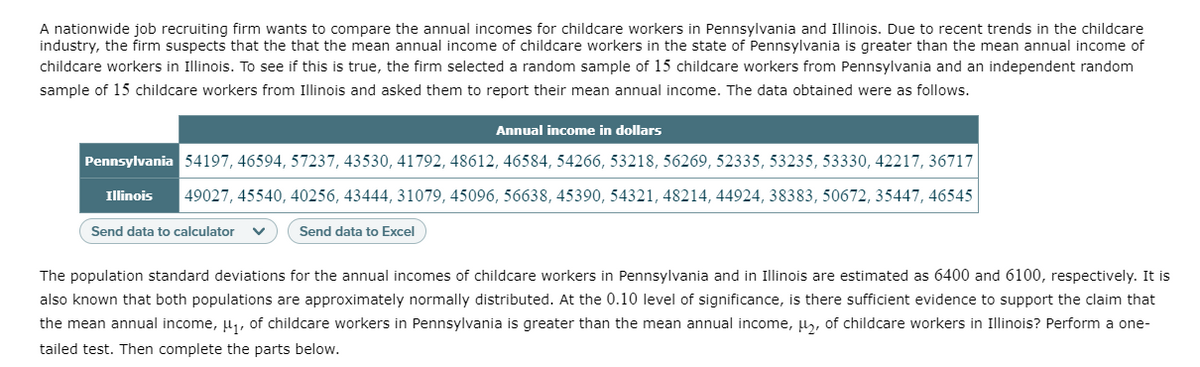
Transcribed Image Text:A nationwide job recruiting firm wants to compare the annual incomes for childcare workers in Pennsylvania and Illinois. Due to recent trends in the childcare
industry, the firm suspects that the that the mean annual income of childcare workers in the state of Pennsylvania is greater than the mean annual income of
childcare workers in Illinois. To see if this is true, the firm selected a random sample of 15 childcare workers from Pennsylvania and an independent random
sample of 15 childcare workers from Illinois and asked them to report their mean annual income. The data obtained were as follows.
Annual income in dollars
Pennsylvania 54197, 46594, 57237, 43530, 41792, 48612, 46584, 54266, 53218, 56269, 52335, 53235, 53330, 42217, 36717
Illinois
49027, 45540, 40256, 43444, 31079, 45096, 56638, 45390, 54321, 48214, 44924, 38383, 50672, 35447, 46545
Send data to calculator
Send data to Excel
The population standard deviations for the annual incomes of childcare workers in Pennsylvania and in Illinois are estimated as 6400 and 6100, respectively. It is
also known that both populations are approximately normally distributed. At the 0.10 level of significance, is there sufficient evidence to support the claim that
the mean annual income, u,, of childcare workers in Pennsylvania is greater than the mean annual income, µ, of childcare workers in Illinois? Perform a one-
tailed test. Then complete the parts below.
Expert Solution
This question has been solved!
Explore an expertly crafted, step-by-step solution for a thorough understanding of key concepts.

Step by step
Solved in 6 steps with 1 images

Knowledge Booster


Learn more about
Need a deep-dive on the concept behind this application? Look no further. Learn more about this topic, statistics and related others by exploring similar questions and additional content below.Recommended textbooks for you
Holt Mcdougal Larson Pre-algebra: Student Edition…
Algebra
ISBN:
9780547587776
Author:
HOLT MCDOUGAL
Publisher:
HOLT MCDOUGAL

Glencoe Algebra 1, Student Edition, 9780079039897…
Algebra
ISBN:
9780079039897
Author:
Carter
Publisher:
McGraw Hill

College Algebra (MindTap Course List)
Algebra
ISBN:
9781305652231
Author:
R. David Gustafson, Jeff Hughes
Publisher:
Cengage Learning
Holt Mcdougal Larson Pre-algebra: Student Edition…
Algebra
ISBN:
9780547587776
Author:
HOLT MCDOUGAL
Publisher:
HOLT MCDOUGAL
Glencoe Algebra 1, Student Edition, 9780079039897…
Algebra
ISBN:
9780079039897
Author:
Carter
Publisher:
McGraw Hill
College Algebra (MindTap Course List)
Algebra
ISBN:
9781305652231
Author:
R. David Gustafson, Jeff Hughes
Publisher:
Cengage Learning
