1. State your hypotheses (in words). 2. Calculate the degree of freedom. 3. Identify the critical value.
1. State your hypotheses (in words). 2. Calculate the degree of freedom. 3. Identify the critical value.

Glencoe Algebra 1, Student Edition, 9780079039897, 0079039898, 2018
18th Edition
ISBN:9780079039897
Author:Carter
Publisher:Carter
Chapter10: Statistics
Section: Chapter Questions
Problem 13PT

Related questions

Question
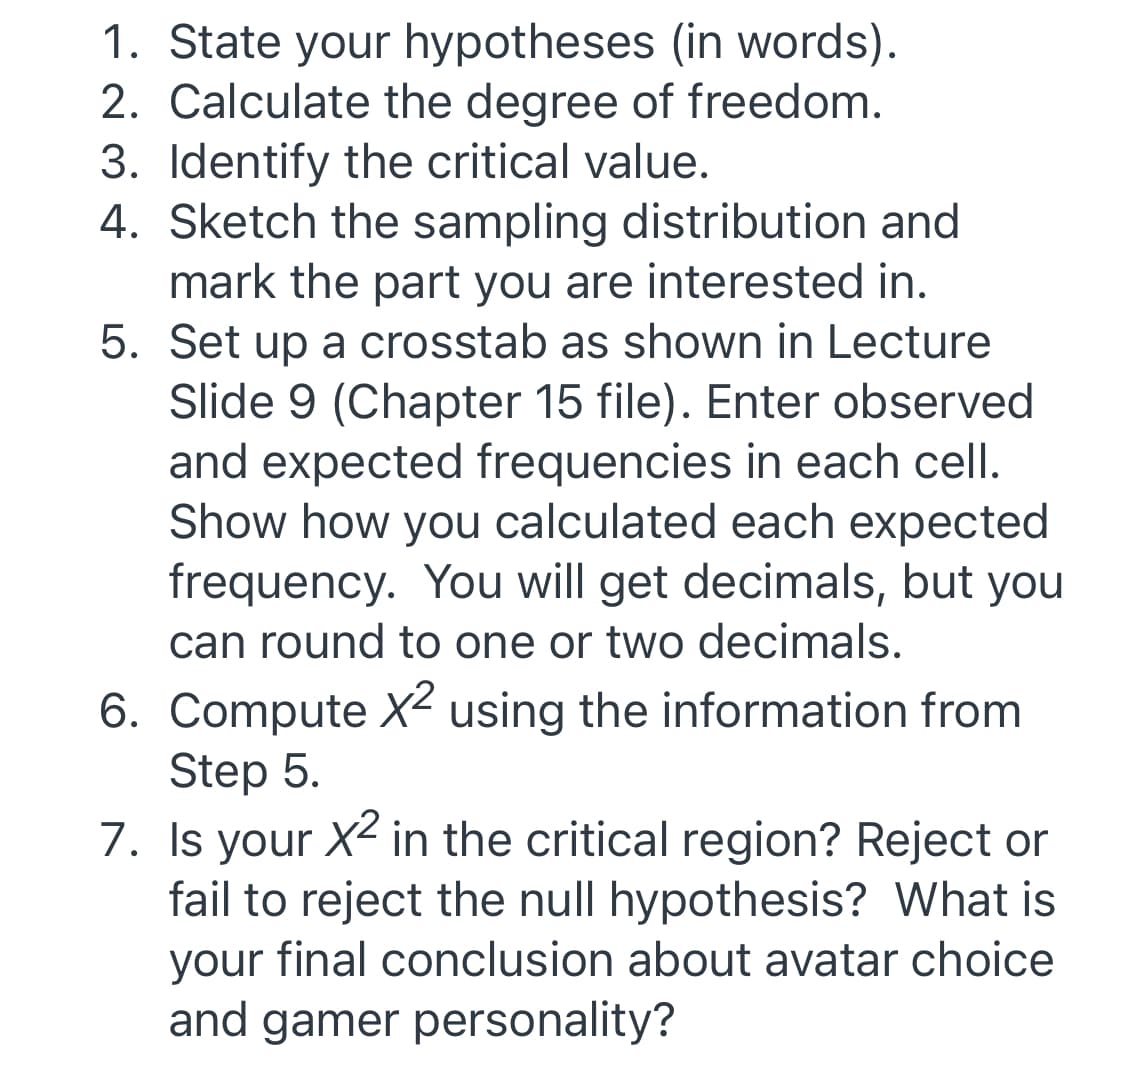
Transcribed Image Text:1. State your hypotheses (in words).
2. Calculate the degree of freedom.
3. Identify the critical value.
4. Sketch the sampling distribution and
mark the part you are interested in.
5. Set up a crosstab as shown in Lecture
Slide 9 (Chapter 15 file). Enter observed
and expected frequencies in each cell.
Show how you calculated each expected
frequency. You will get decimals, but you
can round to one or two decimals.
6. Compute X² using the information from
Step 5.
7. Is your X2 in the critical region? Reject or
fail to reject the null hypothesis? What is
your final conclusion about avatar choice
and gamer personality?
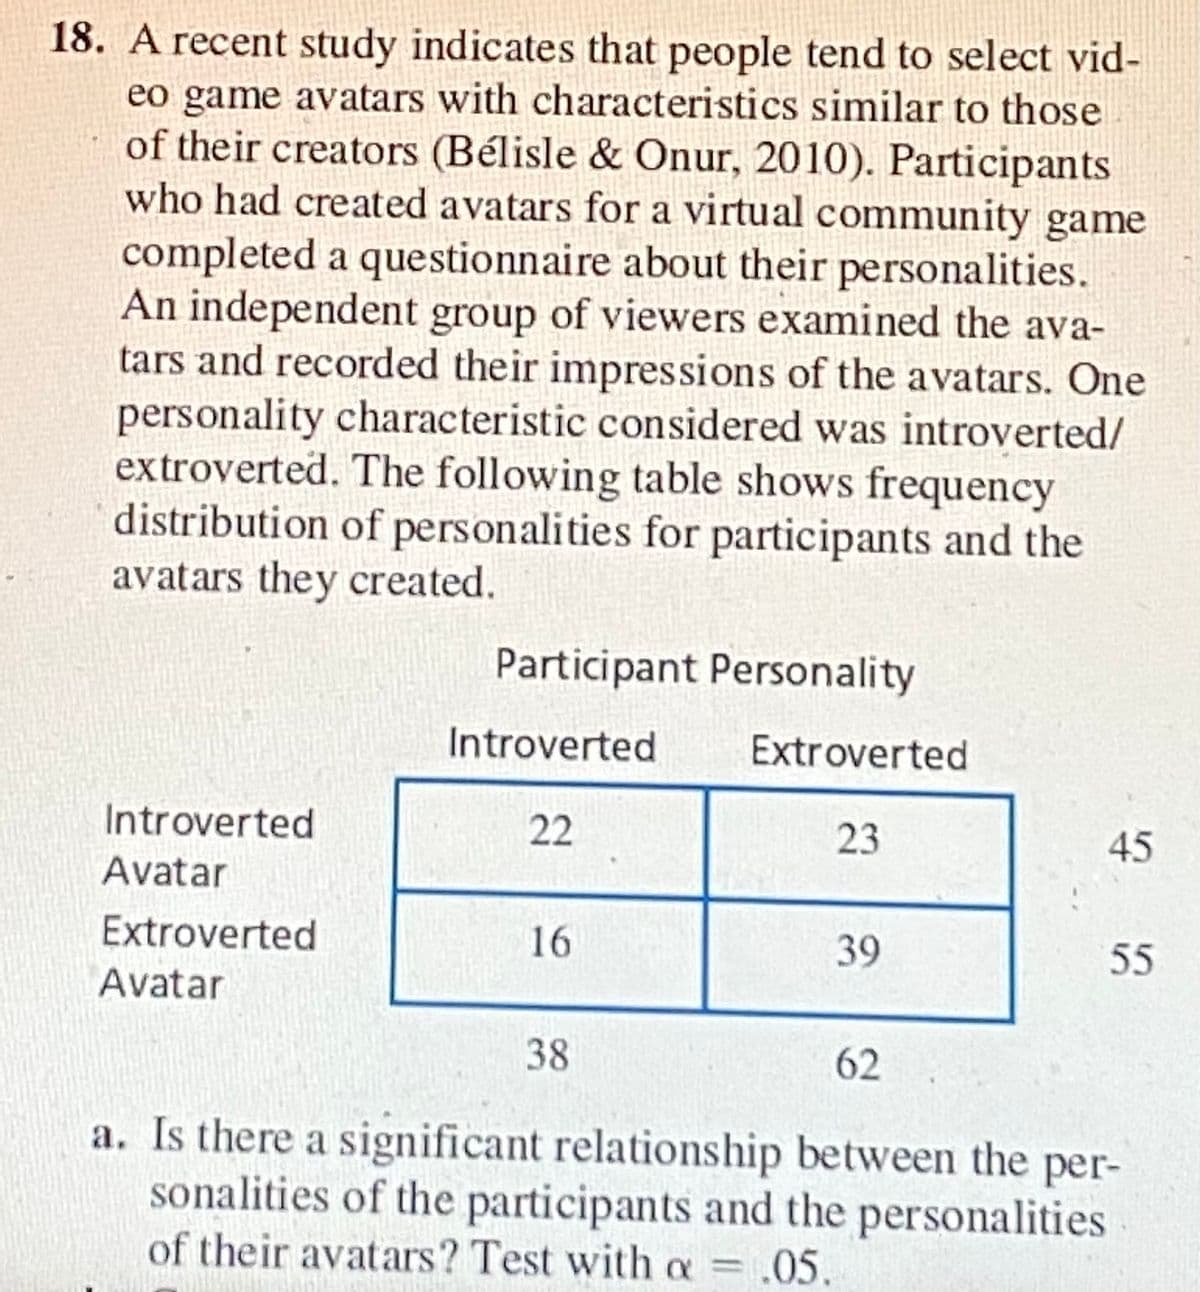
Transcribed Image Text:18. A recent study indicates that people tend to select vid-
eo game avatars with characteristics similar to those
of their creators (Bélisle & Onur, 2010). Participants
who had created avatars for a virtual community game
completed a questionnaire about their personalities.
An independent group of viewers examined the ava-
tars and recorded their impressions of the avatars. One
personality characteristic considered was introverted/
extroverted. The following table shows frequency
distribution of personalities for participants and the
avatars they created.
Participant Personality
Introverted
Extroverted
Introverted
22
23
45
Avatar
Extroverted
16
39
55
Avatar
38
62
a. Is there a significant relationship between the per-
sonalities of the participants and the personalities
of their avatars? Test with a = .05.
Expert Solution
This question has been solved!
Explore an expertly crafted, step-by-step solution for a thorough understanding of key concepts.

This is a popular solution!

Trending now
This is a popular solution!

Step by step
Solved in 4 steps with 1 images

Knowledge Booster


Learn more about
Need a deep-dive on the concept behind this application? Look no further. Learn more about this topic, statistics and related others by exploring similar questions and additional content below.Recommended textbooks for you
Glencoe Algebra 1, Student Edition, 9780079039897…
Algebra
ISBN:
9780079039897
Author:
Carter
Publisher:
McGraw Hill

Holt Mcdougal Larson Pre-algebra: Student Edition…
Algebra
ISBN:
9780547587776
Author:
HOLT MCDOUGAL
Publisher:
HOLT MCDOUGAL
Glencoe Algebra 1, Student Edition, 9780079039897…
Algebra
ISBN:
9780079039897
Author:
Carter
Publisher:
McGraw Hill
Holt Mcdougal Larson Pre-algebra: Student Edition…
Algebra
ISBN:
9780547587776
Author:
HOLT MCDOUGAL
Publisher:
HOLT MCDOUGAL