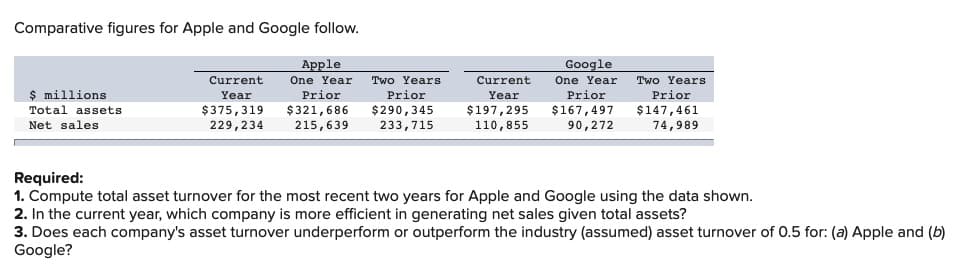
Comparative figures for Apple and Google follow. Apple Google One Year Prior Two Years Prior Current Year $375,319 229,234 One Year Prior $321,686 215,639 Two Years Prior $290,345 233,715 Current Year $ millions Total assets Net sales $197,295 $167,497 $147,461 90,272 74,989 Required: 1. Compute total asset turnover for the most recent two years for Apple and Google using the data shown. 2. In the current year, which company is more efficient in generating net sales given total assets? 3. Does each company's asset turnover underperform or outperform the industry (assumed) asset turnover of 0.5 for: (a) Apple and (b) Google?


Q: Lok Company reports net sales of $5,856,480 for Year 2 and $8,679,690 for Year 3. End-of-year…
A: Total assets turnover = Net sales / Average total assets where, Average total assets = (beginning…
Q: The Home Depot reported the following data (in millions) in its recent financial statements: Year 2…
A: The asset turnover ratio measures the value of a company's sales or revenue relative to the value of…
Q: Blossom Company reports the following information (in millions) during a recent year: net sales,…
A: Return on assets =Net earnings / Average total assets Where, Average total assets = (total assets,…
Q: Computing the return on total assets. Ive looked in the book but I keep getting the same answer and…
A: 1 (a)
Q: McDonald’s Corporation (MCD) reported the following balance sheet and income statement data for two…
A: Return on Asset is a type of Ratio which comes under Profitability Ratio Category.It gives how much…
Q: Maxim Company reported beginning and ending total assets of $140,000 and $160,000, respectively.…
A: Average total assets = (Beginning total assets + Ending total assets) /2 = ($140,000+$160,000) / 2 =…
Q: following data have been extracted from the year-end reports of two companies – Company A and…
A: Net operating income (NOI) is a metric used to assess the viability of income-producing real estate…
Q: Average total assets (excluding long-term inve
A: The Asset turnover ratio compares the worth of a company's sales or revenues to the value of its…
Q: A company reports the following: Sales $8,296,860 Average total assets (excluding long-term…
A: Ratio analysis is a method of measuring the financial position of the organization with different…
Q: he following information is available from the annual reports of Blossom Company and Crane Company.…
A: asset turnover formula: asset turnover = salestotal asset return on asset formula: return on asset…
Q: Computing Asset Ratios The following information relates to Mazy's Inc. $ millions Total Assets…
A: Asset turnover ratio measures the effectiveness in which the business uses its total assets to…
Q: A company reports the following: Sales $1,304,800 Average total assets (excluding long-term…
A: Formula: Asset turnover ratio = Sales / Average total assets
Q: Staples, Inc. is one of the largest suppliers of office products in the United States. Suppose it…
A: Formulas: Asset turnover ratio = Sales / average value of assets…
Q: Select financial statement data for two recent years for Davenport Company are as follows: Sales…
A: a. 20Y5 Fixed Asset Turnover Ratio = Net SalesAverage Total…
Q: Aneko Company reports the following: net sales of $14,800 for Year 2 and $13,990 for Year 1;…
A: The ratio refers to the relationship that exists between two variables. In accounting, the ratio is…
Q: Financial statement data for years ending December 31 for Dennis Company follow: Year 2…
A: Fixed Assets Turnover Ratio : it is the relation between Average Fixed Assets and Net turnover.…
Q: Average Book Sales (in Value of Fixed Assets Company (Industry) millions) (in millions) Comcast…
A: Fixed Assets Turnover : This ratio measure the efficiency of the company,how effectively company…
Q: Apple Inc. Consolidated Income Statements In millions Year ended Sept. 30, 2018 $ 265,595 Year ended…
A: Financial ratios refers to the ratios that represent the financial data of the company. This ratios…
Q: Selected current year company information follows: Net income Net sales Total liabilities,…
A: Assets Turnover ratio = Net sales / Average total assets Average total assets = (Assets at the…
Q: Asset turnover A company reports the following: Sales $6,480,000 Average total assets 2,400,000…
A: 1. The assets turnover ratio = Sales / Average total assets (excluding long term investment)
Q: Staples, Inc. is one of the largest suppliers of office products in the United States. Suppose it…
A: As A part is scratched of so we are answering only B part based on given data.
Q: Last year's asset turnover of All is Well Company was 3.0. This year, the company's sales increased…
A: Assets turnover ratio =Net sales / Average total assets where, Average total assets = (Beginning…
Q: Find online the annual 10-K report for Costco Wholesale Corporation (COST) for fiscal year 2015…
A: Under DuPont analysis, return on equity is computed by multiplying the three ratios which are asset…
Q: Your company has net sales revenue of $43 million during the year. At the beginning of the year,…
A: Fixed asset turnover ratio = Net sales revenue/Average fixed assets, where, Average fixed assets =…
Q: Asset turnover A company reports the following: Sales $724,200 Average total assets 426,000…
A: The asset turnover ratio can be calculated by dividing the net sales value by the average of total…
Q: Office Depot, Inc. is one of the largest suppliers of office products in the United States. Suppose…
A: Asset turnover ratio is the ratio of Net Sales divided by the amount of average assets invested.…
Q: Barry's BBQ had sales revenue for the year of $450 million and net income of $75 million. Total…
A: The financial ratios can be calculated with the given data
Q: Sheridan Company reports the following information (in millions) during a recent year: net sales,…
A: 1. Calculation of return on assets:
Q: A company reports the following:Sales $4,400,000Average total assets…
A: Asset Turnover: Asset turnover refers to the ratio calculated which determines the amount of sales…
Q: Sales $2,400,000 Average total assets (excluding long-term investments) 1,500,000 Determine the…
A:
Q: Asset turnover A company reports the following: Sales $1,102,500 Average total assets (excluding…
A: >Asset Turnover Ratio--The Asset Turnover ratio measures how efficiently the asset invested are…
Q: Carla Vista Co. reports the following information (in millions) during a recent year: net sales,…
A: Step 1: Compute the average total assets: Step 2: Compute the return on assets: Thus, the return…
Q: What is Office Depot, Inc.’s (a) asset turnover and (b) profit margin? (Round to two decimals.)…
A:
Q: A company reports the following: Sales $8,782,430 Average total assets (excluding long-term…
A: Accounting ratio: It is a number expressed in terms of another to establish relationship among…
Q: McDonald’s Corporation reports total average assets of $28.9 billion and net sales of $20.5 billion.…
A: Formulas: Asset turnover ratio = Net sales / Average total assets
Q: McDonald’s Corporation (MCD) reported the following balance sheet and income statement data for two…
A: Assets turnover ratio = Net Sales/ Average Total Assets
Q: Projected total revenue for the following year would be:
A: Accounting: Accounting is the art of recording, classifying and summarizing in a significant…


Trending now
This is a popular solution!

Step by step
Solved in 2 steps with 2 images

- I was given only this document for an assignment: What is the Fiscal Year End Date?Amazon: December 31st, 2019Walmart: January 31st, 2020Financial Statements data:Amazon:Net Sales: $280,522,000,000Basic net income per common share: $23.46Total current assets: $96,334,000,000Retained earnings: $31,220,000,000Net cash provided by operating activities: $38,514,000,000Inventory LIFOWalmart:Net Sales: $519,926,000,000Basic net income per common share: $5.22Total current assets: $61,806,000,000Retained earnings: $83,943,000,000Net cash provided by operating activities: $25,255,000,000Inventory: FIFO ANSWER THE FOLLOWING QUESTIONS:What are 3 differences between accounting policies from each company and why do you think they are different? I'm not sure exactly what the 3 differences are. I believe (1) is the fiscal year versus the calendar year ending maybe due to Walmart having more seasonal sales like Christmas, and (2) is the FIFO vs LIFO method - but I'm not sure why they would choose…In the income statement below, ABC Trade Inc. wants to find the resulting net income for the year 2018 (in million). What is the right amount? Income Statement ($ Million) Year End 2015 2016 2017 2018 Sales 1,234.90 1,251.70 1,300.40 1,334.40 Cost of Sales (679.10) (659.00) (681.30) (667.00) Gross Operating Income Selling & Administration (339.70) (348.60) (351.20) (373.30) Depreciation (47.50) (52.00) (55.90) (75.20) Other Income/Expenses 11.80 7.60 7.00 8.20 Earnings Before Interest and Taxes Interest Income 1.30 1.40 1.70 2.00 Interest Expense (16.20) (15.10) (20.50) (23.70) Pre Tax Income Income Taxes (56.80) (64.20) (67.50) (72.60) Net Income Dividends (38.30) (38.70) (39.80) (40.10) Addition to Retained Earnings Group of answer choices 121.8 108.7 132.7 132.8 No choice givenThe following information is provided for Sandhill Company and Indigo Corporation. (in $ millions) Sandhill Company Indigo Corporation Net income 2022 $125 $375 Net sales 2022 1540 4500 Total assets 12/31/20 1045 2010 Total assets 12/31/21 1220 3150 Total assets 12/31/22 1175 4070 What is Indigo's return on assets for 2022?
- Given the income statement below, Mega Trade Inc. wants to find the resulting net income for the year 2018 (in million). What is the right amount? Income Statement ($ Million) YEAR END YEAR END YEAR END YEAR END 2015 2016 2017 2018 Sales 1,234.90 1,251.70 1,300.40 1,334.40 Cost Sales -679.1 -659 -681.3 -667 Gross Operating Income Selling & Administration -339.7 -348.6 -351.2 -373.3 Depreciation -47.5 -52 -55.9 -75.2 Other Income/Expenses 11.8 7.6 7 8.2 Earnings Before Interest and Taxes Interest Income 1.3 1.4 1.7 2 Interest Expense -16.2 -15.1 -20.5 -23.7 Pre Tax Income Income Taxes -56.8 -64.2 -67.5 -72.6 Net Income Dividends -38.3 -38.7 -39.8 -40.1 Addition to Retained EarningsPrepare the Pro-Forma Statement of Financial Position for the year ending 31 December 2023 INFORMATIONSibiya ProjectsStatement of Comprehensive Income for the year ended 31 December 2022 RSales 10 000 000Cost of sales (5 750 000)Gross profit 4 250 000Variable, selling and administrative costs (1 500 000)Fixed selling and administrative costs (500 000)Net profit 2 250 000 Statement of Financial Position for the year ended 31 December 2022ASSETS RNon-current assets 800 000Property, plant and equipment 800 000 Current assets 3 400 000Inventories 1 600 000Accounts receivable 600 000Cash 1 200 000TOTAL ASSETS 4 200 000 EQUITY AND LIABILITIESEquity 3 760 000 Current liabilities 440 000Accounts payable 440 000TOTAL ASSETS AND LIABILITIES 4 200 000 Additional informationA. The sales budget for 2023 is as follows:First Quarter Second Quarter Third Quarter Fourth QuarterR2 625 000 R2 750 000 R2 875 000 R2 750 000 B. 90% of sales is collected in the quarter of the sale and 10% in the quarter…Given the income statement below, Mega Trade Inc. wants to find the resulting net income for the year 2016 (in million). What is the right amount? Income Statement ($ Million) YEAR END YEAR END YEAR END YEAR END 2015 2016 2017 2018 Sales 1,234.90 1,251.70 1,300.40 1,334.40 Cost Sales -679.1 -659 -681.3 -667 Gross Operating Income Selling & Administration -339.7 -348.6 -351.2 -373.3 Depreciation -47.5 -52 -55.9 -75.2 Other Income/Expenses 11.8 7.6 7 8.2 Earnings Before Interest and Taxes Interest Income 1.3 1.4 1.7 2 Interest Expense -16.2 -15.1 -20.5 -23.7 Pre Tax Income Income Taxes -56.8 -64.2 -67.5 -72.6 Net Income Dividends -38.3 -38.7 -39.8 -40.1
- The following information is available for Advanced Micro Devices (AMD) and Intel for the current year. • AMD’s assets increased by $803 million and its liabilities increased by $267 million.• Intel’s assets increased by $3,771 million and its liabilities decreased by $664 million. a. Complete the following table. Stockholders' Assets Assets Liabilities Liabilities equity $ millions Beg. of year End of year Beg. of year End of year End of year Advanced Micro Devices Answer $3,645 $2,365 Answer Answer Intel $98,599 Answer Answer $42,720 Answer b. Calculate average assets for each company. Round your answers to the nearest million, if applicable. $ millions Avg. Assets Advanced Micro Devices Answer Intel Answer c. Which company has the larger proportion of its assets financed by the company’s owners at year-end?Solvency and Profitability Trend Analysis Addai Company has provided the following comparative information: 20Y8 20Y7 20Y6 20Y5 20Y4 Net income $273,406 $367,976 $631,176 $884,000 $800,000 Interest expense 616,047 572,003 528,165 495,000 440,000 Income tax expense 31,749 53,560 106,720 160,000 200,000 Total assets (ending balance) 4,417,178 4,124,350 3,732,443 3,338,500 2,750,000 Total stockholders’ equity (ending balance) 3,706,557 3,433,152 3,065,176 2,434,000 1,550,000 Average total assets 4,270,764 3,928,396 3,535,472 3,044,250 2,475,000 Average total stockholders' equity 3,569,855 3,249,164 2,749,588 1,992,000 1,150,000 You have been asked to evaluate the historical performance of the company over the last five years. Selected industry ratios have remained relatively steady at the following levels for the last five years: 20Y4–20Y8 Return on total assets 28%…Solvency and Profitability Trend Analysis Addai Company has provided the following comparative information: 20Y8 20Y7 20Y6 20Y5 20Y4 Net income $273,406 $367,976 $631,176 $884,000 $800,000 Interest expense 616,047 572,003 528,165 495,000 440,000 Income tax expense 31,749 53,560 106,720 160,000 200,000 Total assets (ending balance) 4,417,178 4,124,350 3,732,443 3,338,500 2,750,000 Total stockholders’ equity (ending balance) 3,706,557 3,433,152 3,065,176 2,434,000 1,550,000 Average total assets 4,270,764 3,928,396 3,535,472 3,044,250 2,475,000 Average total stockholders' equity 3,569,855 3,249,164 2,749,588 1,992,000 1,150,000 You have been asked to evaluate the historical performance of the company over the last five years. Selected industry ratios have remained relatively steady at the following levels for the last five years: 20Y4–20Y8 Return on total assets 28%…
- Solvency and Profitability Trend Analysis Addai Company has provided the following comparative information: 20Y8 20Y7 20Y6 20Y5 20Y4 Net income $273,406 $367,976 $631,176 $884,000 $800,000 Interest expense 616,047 572,003 528,165 495,000 440,000 Income tax expense 31,749 53,560 106,720 160,000 200,000 Total assets (ending balance) 4,417,178 4,124,350 3,732,443 3,338,500 2,750,000 Total stockholders’ equity (ending balance) 3,706,557 3,433,152 3,065,176 2,434,000 1,550,000 Average total assets 4,270,764 3,928,396 3,535,472 3,044,250 2,475,000 Average total stockholders' equity 3,569,855 3,249,164 2,749,588 1,992,000 1,150,000 You have been asked to evaluate the historical performance of the company over the last five years. Selected industry ratios have remained relatively steady at the following levels for the last five years: 20Y4–20Y8 Return on total assets 28%…Selected comparative statement data for Oriole Company are presented below. All balance sheet data are as of December 31. 20222021Net sales$1,165,000 $1,125,000Cost of goods sold705,000 645,000Interest expense20,000 15,000Net income154,945 145,000Accounts receivable145,000 125,000Inventory105,000 100,000Total assets785,000 700,000Preferred stock (6%)205,000 200,000Total stockholders’ equity635,000 525,000 Compute the following ratios for 2022. (Round answers to 1 decimal place, e.g. 1.8 or 2.5%) (a)Profit marginenter the profit margin in percentages %(b)Asset turnoverenter the asset turnover in times times(c)Return on assetsenter the return on assets in percentages %(d)Return on common stockholders’ equityenter the return on common stockholders' equity in percentages %Prepare a horizontal analysis of the following excerpt of an income statement. Eye Witness Security GmbH Income Statement 2012 2011 Net sales €540.400 €573.000 Cost of goods sold 130.300 165.800 Gross profit (loss) 410.100 407.200 Operating expenses 264.900 205.100 Net income (loss) €145.200 €202.100