Comparative information taken from the Friction Company's financial statements is shown below: (a) Notes receivable (b) Accounts receivable (c) Retained earnings (d) Sales (e) Operating expenses (f) Income taxes payable a. b. C. Required: Using horizontal analysis, show the percentage change and direction (increase or decrease) from Year 1 to Year 2 with Year 1 as the base year. If an item is impossible to compute, enter a "0" in the percentage box and select "Not possible to compute" in the narrative box. d. e. f. % % % Year 2 % Year 1 $25,500 $30,000 106,200 90,000 77,000 70,000 654,000 600,000 160,000 200,000 28,000 20,000
Comparative information taken from the Friction Company's financial statements is shown below: (a) Notes receivable (b) Accounts receivable (c) Retained earnings (d) Sales (e) Operating expenses (f) Income taxes payable a. b. C. Required: Using horizontal analysis, show the percentage change and direction (increase or decrease) from Year 1 to Year 2 with Year 1 as the base year. If an item is impossible to compute, enter a "0" in the percentage box and select "Not possible to compute" in the narrative box. d. e. f. % % % Year 2 % Year 1 $25,500 $30,000 106,200 90,000 77,000 70,000 654,000 600,000 160,000 200,000 28,000 20,000

College Accounting, Chapters 1-27
23rd Edition
ISBN:9781337794756
Author:HEINTZ, James A.
Publisher:HEINTZ, James A.
Chapter24: Analysis Of Financial Statements
Section: Chapter Questions
Problem 8SPB

Related questions
Question
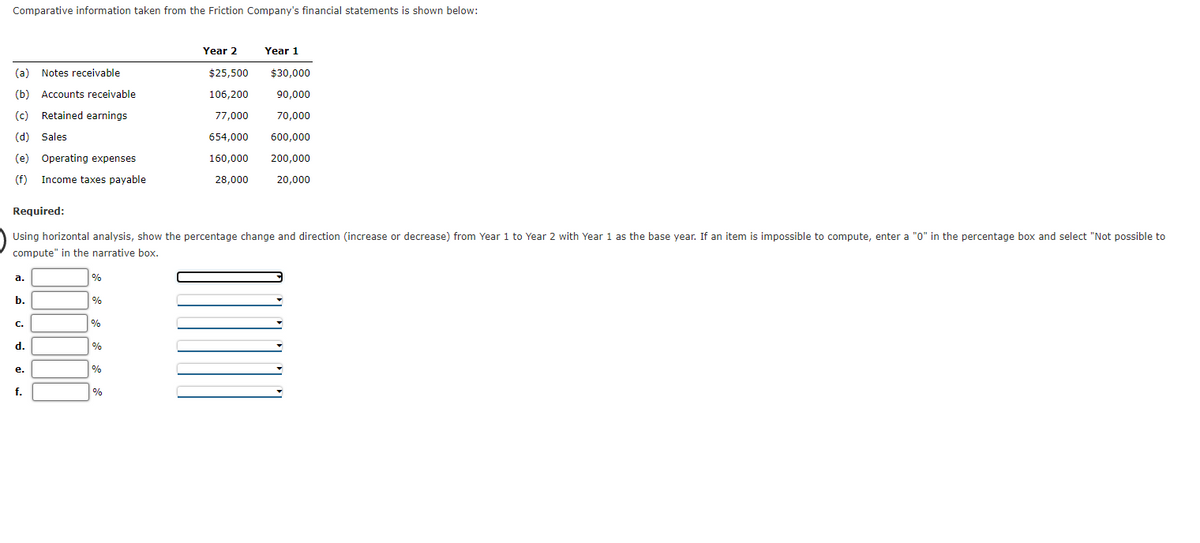
Transcribed Image Text:Comparative information taken from the Friction Company's financial statements is shown below:
(a) Notes receivable
(b) Accounts receivable
(c) Retained earnings
(d) Sales
(e) Operating expenses
(f) Income taxes payable
a.
b.
Required:
Using horizontal analysis, show the percentage change and direction (increase or decrease) from Year 1 to Year 2 with Year 1 as the base year. If an item is impossible to compute, enter a "0" in the percentage box and select "Not possible to
compute" in the narrative box.
C.
d.
e.
f.
%
%
%
%
%
Year 2
%
Year 1
$25,500
$30,000
106,200
90,000
77,000
70,000
654,000 600,000
160,000 200,000
28,000 20,000
Expert Solution
This question has been solved!
Explore an expertly crafted, step-by-step solution for a thorough understanding of key concepts.

This is a popular solution!

Trending now
This is a popular solution!

Step by step
Solved in 3 steps

Knowledge Booster


Learn more about
Need a deep-dive on the concept behind this application? Look no further. Learn more about this topic, accounting and related others by exploring similar questions and additional content below.Recommended textbooks for you
College Accounting, Chapters 1-27
Accounting
ISBN:
9781337794756
Author:
HEINTZ, James A.
Publisher:
Cengage Learning,

Managerial Accounting
Accounting
ISBN:
9781337912020
Author:
Carl Warren, Ph.d. Cma William B. Tayler
Publisher:
South-Western College Pub

Financial Accounting
Accounting
ISBN:
9781337272124
Author:
Carl Warren, James M. Reeve, Jonathan Duchac
Publisher:
Cengage Learning
College Accounting, Chapters 1-27
Accounting
ISBN:
9781337794756
Author:
HEINTZ, James A.
Publisher:
Cengage Learning,
Managerial Accounting
Accounting
ISBN:
9781337912020
Author:
Carl Warren, Ph.d. Cma William B. Tayler
Publisher:
South-Western College Pub
Financial Accounting
Accounting
ISBN:
9781337272124
Author:
Carl Warren, James M. Reeve, Jonathan Duchac
Publisher:
Cengage Learning

Financial Accounting
Accounting
ISBN:
9781305088436
Author:
Carl Warren, Jim Reeve, Jonathan Duchac
Publisher:
Cengage Learning


Financial And Managerial Accounting
Accounting
ISBN:
9781337902663
Author:
WARREN, Carl S.
Publisher:
Cengage Learning,