Complete parts (a) through (h) for the data below. 3. 4 7 8 12 17 20 (c) Graph the line found in part (b) on the scatter diagram Choose the correct graph below. OA. OB. Oc. OD. AY 10- Q 104 20- 20- (d) By hand, determine the least-squares regression line (Round to three decimal places as needed)
Complete parts (a) through (h) for the data below. 3. 4 7 8 12 17 20 (c) Graph the line found in part (b) on the scatter diagram Choose the correct graph below. OA. OB. Oc. OD. AY 10- Q 104 20- 20- (d) By hand, determine the least-squares regression line (Round to three decimal places as needed)

Glencoe Algebra 1, Student Edition, 9780079039897, 0079039898, 2018
18th Edition
ISBN:9780079039897
Author:Carter
Publisher:Carter
Chapter4: Equations Of Linear Functions
Section4.5: Correlation And Causation
Problem 24PFA

Related questions
Question
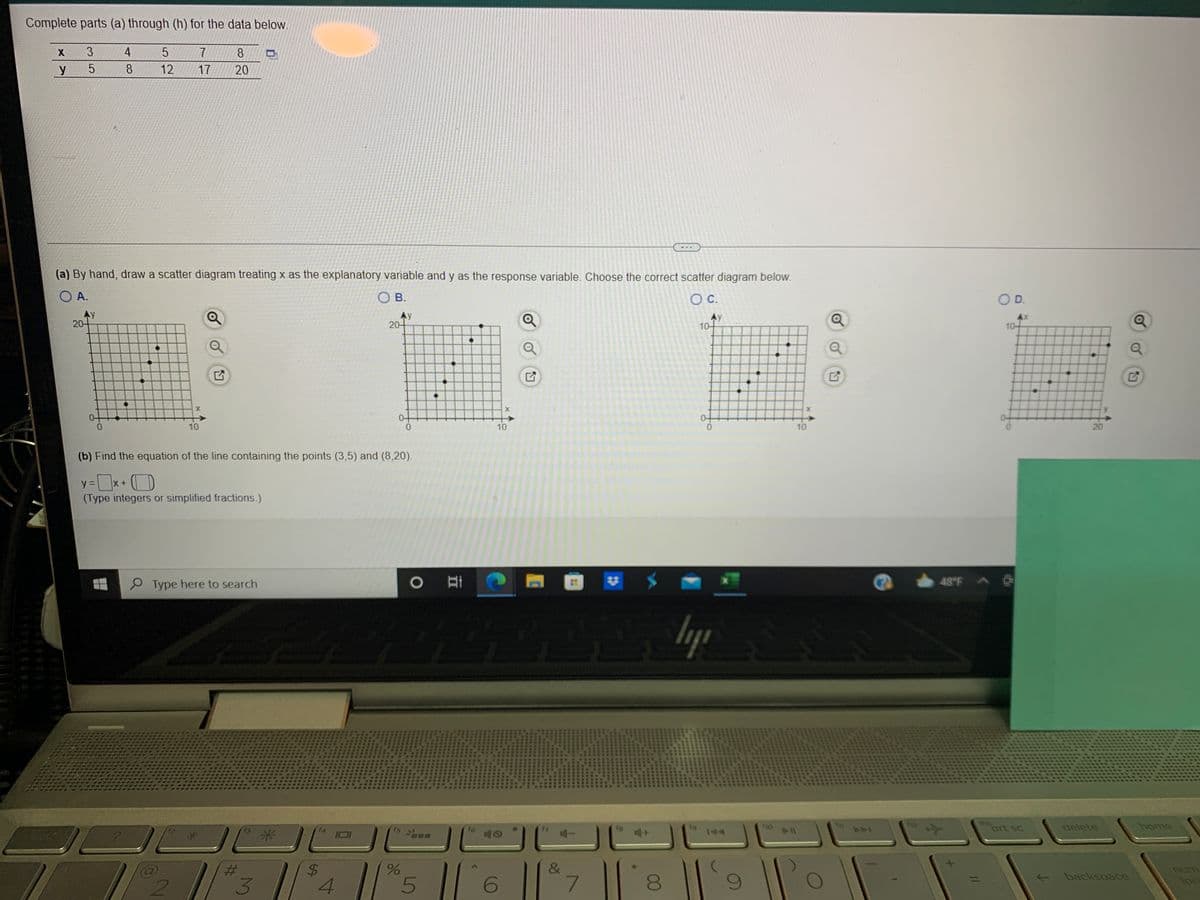
Transcribed Image Text:Complete parts (a) through (h) for the data below.
X
3.
4
8.
y
8
12
17
20
(a) By hand, draw a scatter diagram treating x as the explanatory variable and y as the response variable. Choose the correct scatter diagram below.
O A.
Ов.
OC.
O D.
Ay
20-
Ay
20-
Ay
10-
10-
10
10
0.
10
20
(b) Find the equation of the line containing the points (3,5) and (8,20).
y =
(Type integers or simplified fractions.)
Type here to search
48 F
lyp
12
prt sc
delete
home
14
16
144
144
&
unu
lock
backspace
3
4
8.
%24
米
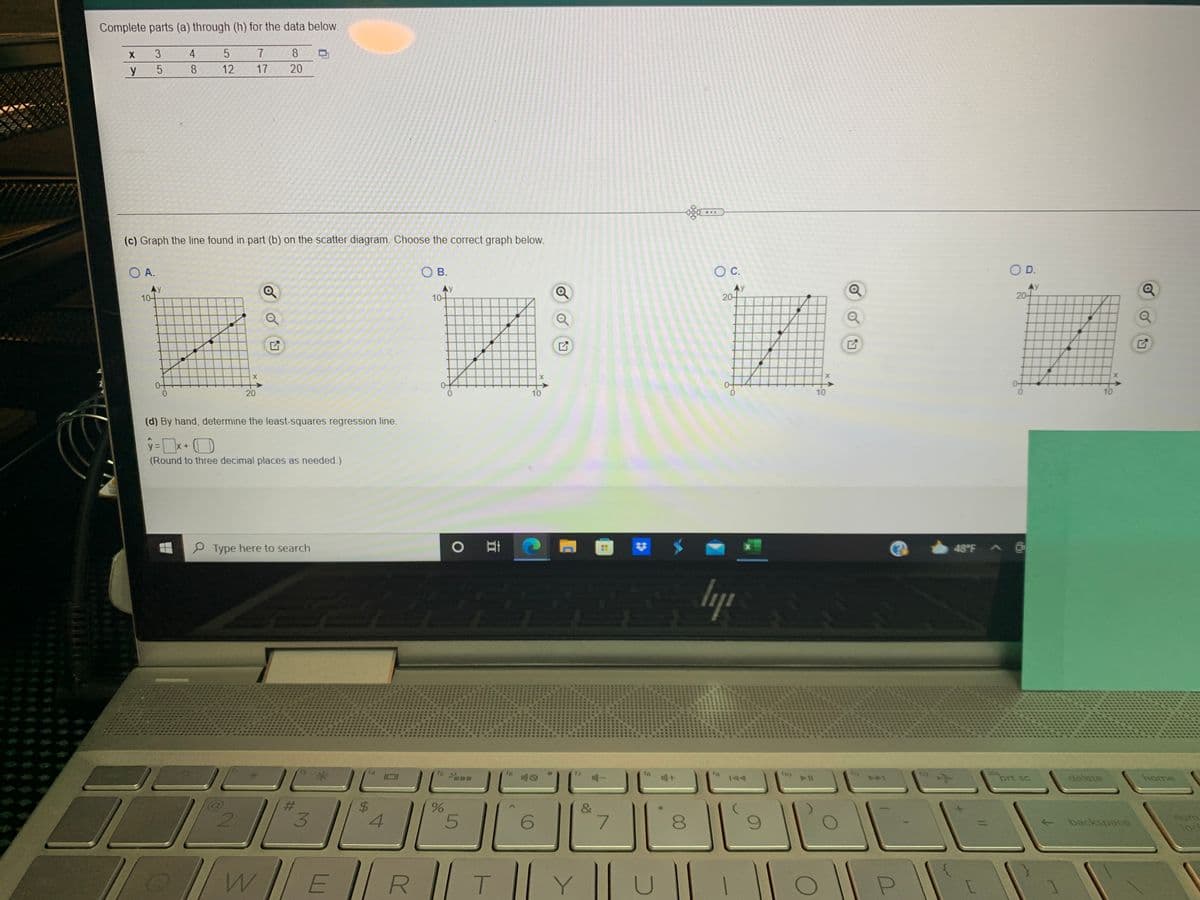
Transcribed Image Text:Complete parts (a) through (h) for the data below.
3
4
8
y
8.
12
17
20
(c) Graph the line found in part (b) on the scatter diagram. Choose the correct graph below.
O A.
O B.
OC.
OD.
Ay
10-
Ay
10-
Ay
20-
Ay
20+
X
0.
20
0.
10
0.
10
10
(d) By hand, determine the least-squares regression line.
y =x+
(Round to three decimal places as needed.)
P Type here to search
48°F A O
lyp
144
prt sc
delete
home
&
4.
num
backspace
/wE|| R || T
Y
00
%24
%23
Expert Solution
This question has been solved!
Explore an expertly crafted, step-by-step solution for a thorough understanding of key concepts.

This is a popular solution!

Trending now
This is a popular solution!

Step by step
Solved in 2 steps with 2 images

Recommended textbooks for you
Glencoe Algebra 1, Student Edition, 9780079039897…
Algebra
ISBN:
9780079039897
Author:
Carter
Publisher:
McGraw Hill

Big Ideas Math A Bridge To Success Algebra 1: Stu…
Algebra
ISBN:
9781680331141
Author:
HOUGHTON MIFFLIN HARCOURT
Publisher:
Houghton Mifflin Harcourt
Glencoe Algebra 1, Student Edition, 9780079039897…
Algebra
ISBN:
9780079039897
Author:
Carter
Publisher:
McGraw Hill
Big Ideas Math A Bridge To Success Algebra 1: Stu…
Algebra
ISBN:
9781680331141
Author:
HOUGHTON MIFFLIN HARCOURT
Publisher:
Houghton Mifflin Harcourt