7. What is the minimum score that a student should have to be awarded? Show vour solution and shade the region under the curve that represents the portion of the population involved in the situation
Q: 2. Consider the foot length and foot width of six female grade 4 students in Morning Star Montessori…
A:
Q: a) For the 25 participants, use the Frequencies option to produce output detailing the following…
A:
Q: Find the probability of the union of the following events. (Show your complete solution, 3 points…
A:
Q: 9. Calculate the Pearson Correlation Coefficient (r): (SHOW YOUR WORK)
A: Given that X Y X \cdot YX⋅Y X^2X2 Y^2Y2 2 4 8 4 16 1 3 3 1 9 3 3 9 9 9 6 6 36…
Q: A fitness center is interested in finding a 99% confidence interval for the mean number of days per…
A: The random variable number of visits follows normal distribution. We have to construct 99%…
Q: An electrical system consists of fourcomponents as illustrated. What is the probability that the…
A:
Q: The reading speed of second grade students in a large city is approximately normal, with a mean of…
A: Consider that the mean and standard deviation of a random variable X are µ and σ, respectively.…
Q: Calculate the relative frequency P(E).
A: there are total 500 novel , n(U ) = 500 no of book read by you no of novel you read= n(Y) = 150 no…
Q: For numbers 1 to 4: A physician is interested to determine if the mean length of waiting time to…
A:
Q: Let X represent the full height of a certain species of tree. Assume that we do not know the…
A:
Q: If the test is done at 95% confidence, the null hypothesis should
A: HER GIVEN, sample mean = 12.75 $ n= 100 standard deviation = $2 here population standard deviation…
Q: Perform a test of hypothesis at 5% level of significance to help the labour union leader make an…
A: Here population standard deviation unknown so use t-test
Q: аppea ally distressed consumers. It allows immediate access to merchandise, and by making all…
A: This question is based on categorical data analysis. The chi square test of homogeneity of prop have…
Q: 15. In linear regression analysis, the difference between an observed value of a response variable…
A: A residual is the difference between an observed value of the response variable and the value…
Q: 80 82 75 78 79 64 A74 56 61 75 25 85 61
A: Arranging the given data set into the ascending order: 56, 56, 59, 59, 61, 61, 64, 64, 70, 71, 71,…
Q: QUESTION 6 Using R, generate a graph to represent respondents by length of time they had their last…
A: From the given information, Q404 column represents the length of time they had their lastPap smear.…
Q: Suppose the heights of the members of a population follow a normal distribution. If the mean height…
A:
Q: Determine the population of interest. Select the correct choice below and, if necessary, fill in the…
A: We have the following statement about the marketing agency.
Q: The quality control manager at a computer manufacturing company believes that the mean life of a…
A: The quality control manager at a computer manufacturing company believes that the mean life of a…
Q: PROBLEM 3. The researcher conducted a study to determine whether the new exercise program will be…
A: Given information: A study was conducted to check the effectiveness of the new exercise program. It…
Q: Compute
A: The given information is presented in the following table as follows: Column 1…
Q: Iranian researchers studied factors affecting patients' likelihood of wearing orthodontic…
A: For the given data Use Anova one way
Q: A Cilain or Pestaurants has historically had a mean wait time of 6 minutes for its customers.…
A:
Q: How does the cost of shipping a standard-sized crate relate to the distance of the destination? Can…
A:
Q: The data represent the results for a test for a certain disease. Assume one individual from the…
A: Given
Q: Stephen Stigler determined in 1977 that the speed of light is 299,710.5 km/sec. In 1882, Albert…
A: The random variable X follows normal distribution. We have to test whether the Michelson’s data is…
Q: (1) Two rubber compounds were tested for tensile strength and the fol- lowing values were found A :…
A: First I want to find mean and standard deviation of both data set . Mean = sum of all…
Q: Tweet tweet: An article reported that 73% of companies have Twitter accounts. An economist thinks…
A:
Q: In each problem show all steps of the hypothesis test using PHANTOMS. If some of the assumptions…
A: Given: Sr. No. Data (x) 1 1.36 2 1.42 3 5.93 4 5.36 5 0.06 6 9.11 7 7.32 8…
Q: Price IndPrice PriceDif AdvExp Demand X1 X2 X4 X3 Y 3.85 3.80 -0.05 5.50 7.38 3.75 4.00 0.25 6.75…
A: Since you have asked multiple questions, we will solve the first question for you. If you want any…
Q: 1. Consider the population consisting of the values (1, 3, 8). a. List all the possible samples of…
A: The given population is (1, 3, 8). We have to create possible samples of size 2 with replacement and…
Q: PROBLEM 4. The researcher conducted an experiment to determine whether font size has an effect on…
A: Analysis of variance is an important topic in hypothesis.
Q: Listed below are the lead concentrations (in ug/g) measured in different Ayurveda medicines.…
A: Solution-: (a) We identify the null and alternative hypothesis (b) Identify the test statistic (c)…
Q: Ame Journal de Botanique reported that the mean height of Begonias grown while being treated with a…
A: Hypothesis Testing and Statistical Test The hypothesis testing is inferential technique to examine…
Q: A bowl contains 10 blue balls and 10 green balls. A girl selects balls at random without looking at…
A:
Q: 2. What is your null hypothesis? (in words)
A: Given that Here Number of participant =7
Q: 19. What is the value of SSx? (SHOW YOUR WORK)
A: We need to find the value of sum of squares of X i.e. SSx using the given graph and table.
Q: As part of your work for an environmental group, you want to see if the mean amount of waste…
A:
Q: Use the Wording of Final Conclusion flow chart interactive to answer the following question. When…
A: Solution-: We want to correct wording of the final conclusion?
Q: Jump to level 1 A home improvement company is interested in improving customer satisfaction rate…
A: Given that Sample size n =287 Favorable cases x =190 Sample proportion p^=x/n =190/287 =0.6620
Q: Match the correlation coefficients with their scatterplots. Select the letter of the scatterplot…
A:
Q: for a certain company, the monthy percentages ot al hipments received on time over the past 12…
A: a) Enter the data into the excel sheet as follows: a) The time series plot is constructed below.…
Q: On the basis of her newly developed technique, a student believes she can reduce the amount of time…
A:
Q: to be tested in each situation by writing your answer on a separate sheet of paper. Translate it…
A: Given that Sample size n =49 Sample mean =5 Sample standard deviation =1.2
Q: 17. How did you make the determination in Question #16?
A: Correlation coefficient is a measure of statistical association between continuous variables.
Q: In 1999, the average percentage of women who received prenatal care per country was 80.1%. The table…
A:
Q: Nationally, patients who go to the emergency room wait an average of 7 hours to be admitted into the…
A: a. In this case, the sample size is less than 30 and moreover, the population standard deviation…
Q: student beginning her senior year has accumulated 90 credits and has a C-minus cumulative grade…
A:
Q: The lifetime of a certain type of automobile tire (in thousands of miles) is normally distributed…
A:
Q: 1. Determine sufficient statistics in the case of a random sample of size n from the uniform (a)…
A:
pls answer no.7 on paper
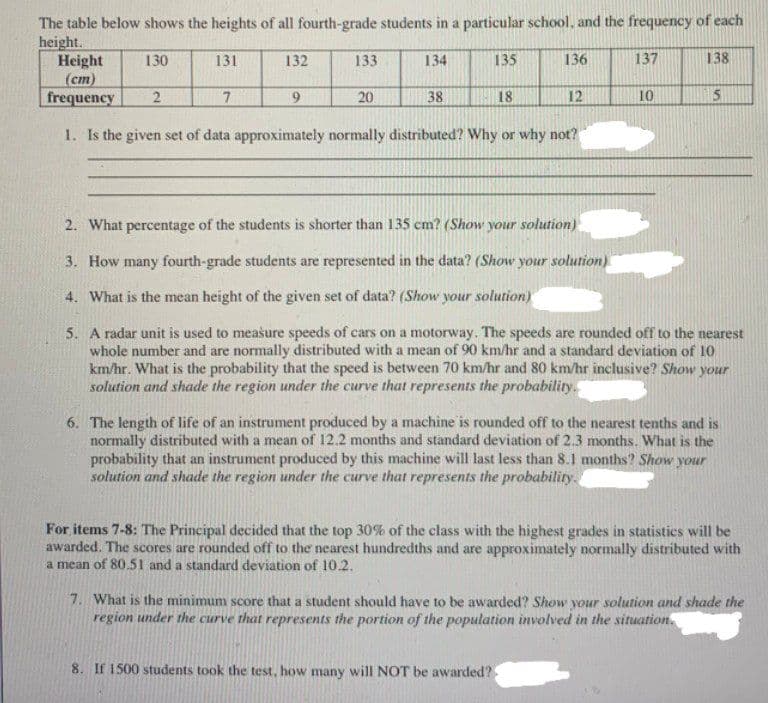
Step by step
Solved in 2 steps with 1 images