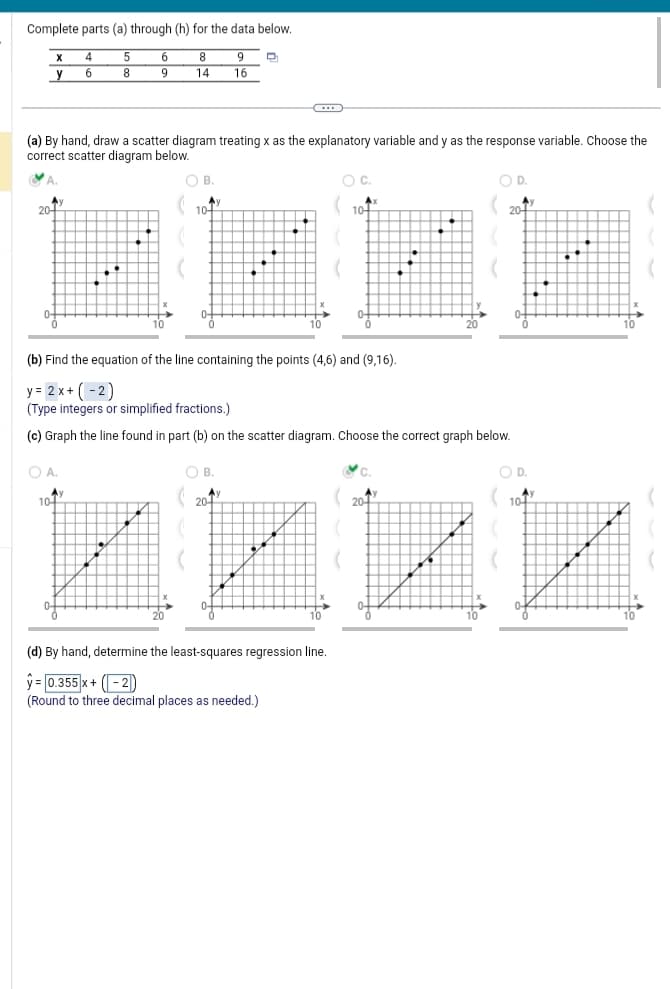
Complete parts (a) through (h) for the data below. 4 5 8 9 6 8 14 16 X y (a) By hand, draw a scatter diagram treating x as the explanatory variable and y as the response variable. Choose the correct scatter diagram below. 20+ OA. 6 9 Ay 104 B. 10- (b) Find the equation of the line containing the points (4,6) and (9,16). y= 2x+ (-2) (Type integers or simplified fractions.) (c) Graph the line found in part (b) on the scatter diagram. Choose the correct graph below. B. 20+ O C. (d) By hand, determine the least-squares regression line. y = 0.355 x + (-2) (Round to three decimal places as needed.) 10 20 20- D. 104 10
Q: Suppose a polling agency reported that 45.0% of registered voters were in favor of raising income…
A: Obtain the 90% confidence interval for the proportion of registered voters who are in favor of…
Q: For a standard normal distribution, find: P(z < 0.61)
A: Answer: From the given data, mean(μ) = 0 Standard deviation(σ) = 1 P(Z<0.61) is,
Q: If X is a random variable with expectation µ and variance cµ2 , where c is a constant. Find a…
A: X= random variable expectation µ and variance cμ2 where c is constant then we need to find the…
Q: Assuming that n₁ = n₂, find the sample sizes needed to estimate (p₁ - p₂) for each of the following…
A: From the provided information, a) Margin of error (E) = 0.12 Confidence level=99% p1 ≈ 0.8 and p2 ≈…
Q: The likelihood that a light bulb is defective is 6%, on a particular production line. Eight light…
A: Answer: From the given data, Let X: Defective light bulb P(Defective) = P = 6% = 0.06 Sample size…
Q: What is the probability that this elevator will be overloaded
A: If the elevator is overloaded then it will exceed its maximum weight so we need to find P(T>3500)…
Q: Find the variance and standard deviation for the following sample data 16, 28, 31, 49, 8
A: Answer: From the given data, 16, 28, 31, 49, 8
Q: Problem#9 34. The Best Predictor of the Winning Percentage The ultimate goal in any sport (besides…
A: We can run a linear regression analysis on the data to find the potential explanatory variable that…
Q: 95% confidence interval of a population proportion is (0.72,0.93) What is the margin of error (round…
A: Answer: From the given data, 95% confidence interval for a population proportion is (0.72 , 0.93)…
Q: Develop a 95% confidence interval estimate of the population mean rating for Miami.
A: The International Air Transport Association surveys business travelers to develop quality ratings…
Q: If the original claim is "The majority of student population are full time students.", then this is…
A: Proportion: The percentage of a population that falls into a certain category has been referred to…
Q: We tested to see if women were more likely to do aerobics than men at the α = 0.02 level, and found…
A: It is needed to test whether women were more likely to do aerobics than men.
Q: Interpret the slope Is the model significant?
A: From the output, the regression equation is : y = 41462 + 2714 *x here the slope = 2714
Q: 15,26,48,9,30 Select one: O a. 181.84 O b. 13.48 O c. 224.3 O d. 15.08
A: Sample data: 15, 26, 48, 9, 30. Variance is a measure of dispersion that indicates how data values…
Q: A professor at a local university noted that the grades of her students were normally distributed…
A: Answer Given Mean = 79 Standard deviation = 10 16.6% = 16.6/100 = 0.166 12.1% = 12.1/100 = 0.121 33%…
Q: The table and scatter plot below compares the amount of food an expectant mother dog ate each day…
A: It is required to use the scatterplot and the given dataset to describe the relationship between the…
Q: ccording to the records of a soft drink company, the bottles for their one liter sized product…
A: From the information, given that Let X denotes the amount of beverage with the population mean of…
Q: The Toyota Camry is one of the best-selling cars in North America. The cost of a previously owned…
A: Independent variable: Miles ( 1000's) Dependent variable : Price ($1000's)
Q: A study of cats and dogs found that 29 of 50 cats and 19 of 50 dogs slept more than 10 hours per…
A: The proportion of the sample taken from the population is tested using the z-test. If the proportion…
Q: (a) Draw a scatter diagram. Comment on the type of relation that appears to exist between x and y.…
A: The dataset on x and y is given. Sample size (n) = 6 x¯=3.8333sx=2.0412y¯=4.3167sy=1.3363r=-0.9153…
Q: For a normally distributed population with μ = 82 and o =40, find P(x ≥185). O a. 0.0049 O b. 2.58 O…
A: The mean is 82 and the standard deviation is 40.
Q: The Customer Service Center in a large New York department store has determined that the amount of…
A: Answer: From the given data, mean (μ) = 16.6 Standard deviation(σ) = 4.04 X ~ Normal…
Q: For the following hypothesis test: HO: m ≤ 14 HA: m >14 a: 0.01 with n = 38, o = 9, and x = 16,…
A: Based on the information provided, we can perform a one-sample z-test to test the given hypothesis…
Q: Find the critical value ze necessary to form a confidence interval at the level of confidence shown…
A: The level of confidence is c=0.91 The Zc is critical value Zc is required to form the confidence…
Q: The spotlight effect refers to overestimating the extent to which others notice your appearance or…
A: Sample size =36 Sample mean=1.8 SS=425 We have to find a...95% confidence interval for population…
Q: A sample of 25 observations is taken from a normal distribution with unknown mean. The sample mean…
A:
Q: A direct mail appeal for contributions from a university's alumni and supporters is considered to be…
A: Solution: Given information: n= 310 Sample size of people x= 67 people receive monetary…
Q: State the hypotheses and identify the claim. :H0= ▼ then claim or not claim :H1= ▼ then claim or…
A: Sample size n =27 Sample mean=22.2 Population standard deviation =3.7 NOTE:- According to bartleby…
Q: each item # 7-8. 7. Researchers study the effect of political commercials and the likelihood of…
A: n=150C.I.=0.56, 0.72
Q: The annual salary for one particular occupation is normally distributed, with a mean of about…
A: The mean of the sampling distribution of the sample mean is obtained below as follows : From the…
Q: Find the critical value zα/2 that corresponds to the confidence level 97%
A: From the provided information, Confidence level = 97%
Q: Which of the following hypothesis is considered one tail test? O a. O b. H1: μ ≤75 HO: μ 75
A: Null hypothesis: The null hypothesis states that there is no difference in the test, which is…
Q: Dr. Erie, a researcher at the Moore County Botany Institute, reported the following correlations.…
A: Correlation coefficient : Correlation coefficient tells about the strength of relationship between…
Q: For a normally distributed population with Mean μ=25 and standard deviation o-12. Find X that…
A: Answer:- Given a normally distributed population with mean μ = 25 and standard deviation σ = 12…
Q: Consider the discrete-time process S,, defined as Sn-1 + Sn 2 Sn-Sn-1+H At+oS-1√AtEn, n = 1,..., N,…
A: We can rewrite the recursion for Sn as Sn=Sn-1+μSn-1+Sn2Δt+σSn-1Δtξn which is equivalent to…
Q: A study was done using a treatment group and a placebo group. The results are shown in the table.…
A: Since you have posted a question with multiple sub parts, we will provide the solution only to the…
Q: A study of 10 countries showed that smaller the percentage change in wages, smaller is the…
A: A study of 10 countries showed that the smaller the percentage change in wages, the smaller the…
Q: The following ages were collected from a sample of study participants. Which one of these ages is…
A: Data 20, 18, 22, 25, 24, 19, 21, 23, 27, 22, 101, 25, 20
Q: State the type of error (Type I or II) that has been made for the following claims. A. Claim: More…
A: Type 1 Error: Type 1 error is the incorrect rejection of a true null hypothesis. This is also known…
Q: The mean number of English courses taken in a two-year time period by male and female college…
A: Given: Sample size of males, n1 = 29 Sample size of females, n2 = 16 Standard deviation for males,…
Q: Using the z table (The Standard Normal Distribution Table), find the critical value (or values) for…
A: The data is as follows: The test is two-tailed with α=0.10
Q: Rhino viruses typically cause common colds. In a test of the effectiveness of echinacea, 42 of the…
A: From the provided information, n1=49x1=42n2=91x2=74 Confidence level = 95%
Q: The average height of all the workers in a hospital is known to be 66.7 inches with a standard…
A: Let X be the random variable from normal distribution with mean (μ) = 66.7, standard deviation (σ)…
Q: Which of the following null hypothesis is considered two tail test? O a. HO: μ ≥99 O b. HO: µμ> 99 O…
A: c.Ho:μ=99
Q: A binomial probability experiment is conducted with the given parameters. Compute the probability of…
A: Given that, The distribution is binomial with parameters, n = 11 p = 0.15 q = 1-p = 1-0.15 = 0.85…
Q: In the country of the United states of Heightlandia, the height measurements of ten-year-old…
A: Mean(μ)=56.3standard deviation(σ)=1.3
Q: The local utility company surveys 11 randomly selected customers. For each survey participant, the…
A: n=11, α=0.02bill = 19.6+4.44×sizeβ0=19.6, seβ0=0.52β1=4.44, seβ1=0.2
Q: Researchers conducting a study of 15 children with a diagnosis of ADHD wish to assess whether the…
A: The maximum value is nothing but the highest data point that occurs in the data after arranging the…
Q: A binomial probability experiment is conducted with the given parameters. Compute the probability of…
A: Answer:- Given, Sample size, n = 10 Probability of success on a trial, p = 0.5 Number of success,…
Q: A simple random sample of front-seat occupants involved in car crashes is obtained. Among 2740…
A: a simple random sample of a front seat occupants involved in a car crash is obtained 2740-38 7645-12
Do last three parts
Trending now
This is a popular solution!
Step by step
Solved in 4 steps with 4 images
- A lecturer at WIN wanted to know if he can predict student’s quiz results by asking them to complete a simple survey. The result of the survey is found in the file: Assignment 2 sem22020 data set 1.Quiz ResultActual Mark (0-15) for quiz student attainedEQRQuiz score (0-15) expected to get before taking the quizStudy Hrs.Number of hours per week (on average) spent studying for StatisticsAgeAge (in years)BBTSatisfaction rating of Big Bang TheorySexM=1 F=0MBMB=1 for good math background, otherwise 0MCMC= 1 if math centre is used regularly, otherwise 0AuHSAuHS = 1 if student completed high school in Australia, otherwise 0LMLM=1 if student likes math, 0 otherwiseTask 1: Variable List(a) Using the variables listed in the table above, Describe each variable.(b) State for each variable whether it is qualitative or quantitative; if it is qualitative, state whether it is nominal or ordinal, and if it is quantitative, state whether it is discrete or continuous.Task 2: HistogramCreate a histogram…The management of a supermarket wants to find if there is a relationship between the number of times a specific product is promoted on the intercom system in the store(x) and the number of units of that product sold (y). To experiment, the management selected a product and promoted it on the intercom system for 7 days, recording the number of times this product was promoted each day and the number of units sold. Summaries of a study conducted gave the following results: ∑x=177, ∑y= 144, SSxx=809.4286, SSyy=261.7143, SSxy= 407.8571 a) Calculate the correlation coefficient (r) relating number of times this product was promoted each day and the number of units sold. b) Find the regression line.Ernesto is a web developer who is looking to determine which of two types of advertisements are the most cost effective. He suspects that advertisements with animations generate more clicks than advertisements without animations but wants to confirm his intuition before he starts recommending advertisements with animations to his clients. Ernesto creates advertisements with animations for 12 different products and then creates advertisements without animations for those same products. Then he measures the click-through rate for those advertisements. The data are provided below (given as percentages of total visitors to the site who clicked on the advertisement). Assume that the conditions required for this hypothesis test are satisfied. Use a calculator to test the paired data, where α=0.01. Compute the sample differences d using d=Without−With. Which of the following statements are accurate for this hypothesis test in order to evaluate the claim that the true mean difference between…
- In 2019, investigators from Brown University would like to determine the relationship of nail polish remover and ovarian cancer in women. A cohort of n=1000 beauticians aged 18-64 years old was identified and followed up after five years. After the follow-up period, there were × = 20 new cases of breast cancer were diagnosed. It is known that the incidence of ovarian cancer over the time period for average American women is 7/1000. The researchers wish to determine if the incidence computed in this study is equal to the incidence known in America at 0.01 level of significance.man loves, as everyone should, to collect and analyze statistical information. He wishes to find a relationship between how many hours students study and how they do on their statistics tests. He takes a random sample of 16 students at Ideal U., asks how many hours they studied for a university-wide stat test and how they did on the test, enters the data into a computer for analysis and presents the results below. ANALYSIS OF HOURS AND GRADES (n = 16): Descriptive Statistics: HOURS GRADES Mean: 4.2 75.8 Mode: 5.0 79.0 St. Dev: 2.3 10.1 Quartiles: Q0 2.0 34.0 Q1 3.2 53.7 Q2 4.7 78.5 Q3 6.3 86.9 Q4 9.0 97.0 Regression Analysis: Reg. Eq. is: GRADE = 16.9 + 9.025*HOURS Rsquared = .985 std error = 0.027 F = 8.52 p = .018 What is the median number of hours studied? a. 2.3 b. 4.7 c. 4.5 d. 4.2 e. 5.5 f. 5 g. cannot be determinedman loves, as everyone should, to collect and analyze statistical information. He wishes to find a relationship between how many hours students study and how they do on their statistics tests. He takes a random sample of 16 students at Ideal U., asks how many hours they studied for a university-wide stat test and how they did on the test, enters the data into a computer for analysis and presents the results below. ANALYSIS OF HOURS AND GRADES (n = 16): Descriptive Statistics: HOURS GRADES Mean: 4.2 75.8 Mode: 5.0 79.0 St. Dev: 2.3 10.1 Quartiles: Q0 2.0 34.0 Q1 3.2 53.7 Q2 4.7 78.5 Q3 6.3 86.9 Q4 9.0 97.0 Regression Analysis: Reg. Eq. is: GRADE = 16.9 + 9.025*HOURS Rsquared = .985 std error = 0.027 F = 8.52 p = .018 We know that 25% of all the grades falls into which of these regions? a. 78.5 to 79.0 b. 78.5 to 86.9 c. 75.8 to 86.9 d. 75.8 to 97.0 e. 78.5 to 97.0 f. 75.8 to 79.0
- man loves, as everyone should, to collect and analyze statistical information. He wishes to find a relationship between how many hours students study and how they do on their statistics tests. He takes a random sample of 16 students at Ideal U., asks how many hours they studied for a university-wide stat test and how they did on the test, enters the data into a computer for analysis and presents the results below. ANALYSIS OF HOURS AND GRADES (n = 16): Descriptive Statistics: HOURS GRADES Mean: 4.2 75.8 Mode: 5.0 79.0 St. Dev: 2.3 10.1 Quartiles: Q0 2.0 34.0 Q1 3.2 53.7 Q2 4.7 78.5 Q3 6.3 86.9 Q4 9.0 97.0 Regression Analysis: Reg. Eq. is: GRADE = 16.9 + 9.025*HOURS Rsquared = .985 std error = 0.027 F = 8.52 p = .018 What problem might there be in using the regression model to predict what grade a student might get if they studied 10 hours? a. The predicted grade for 10 hours is more than 100, which is impossible. b. The value of 10…A sales manager wants to examine the relationship between the number of daily customers (x) and the revenue generated (y). For this purpose, he made observations in a randomly chosen 6 days for a store and observed the number of daily customers and the revenue (1000 TL). The personally created data set for the x and y variables is included in the attached “Homework data” file. Using the data set defined on your behalf; x1 x2 x3 x4 x5 x6 y1 y2 y3 y4 y5 y6 sb1 Burak data 74 86 96 105 110 124 290 307 331 406 421 481 0.491 a) Create the regression equation b) Interpret b0 and b1 values c) Test and interpret whether there is a linear relationship between the number of daily customers and the income obtained at the level of α = 0.05 significance. d) Establish and interpret the 95% confidence interval for β1.A sales manager wants to examine the relationship between the number of daily customers (x) and the revenue generated (y). For this purpose, he made observations in a randomly chosen 6 days for a store and observed the number of daily customers and the revenue (1000 TL). The personally created data set for the x and y variables is included in the attached “Homework data” file. Using the data set defined on your behalf; x1 x2 x3 x4 x5 x6 y1 y2 y3 y4 y5 y6 sb1 Burak data 74 86 96 105 110 124 290 307 331 406 421 481 0.491 a) Create the regression equation b) Interpret b0 and b1 values c) Test and interpret whether there is a linear relationship between the number of daily customers and the income obtained at the level of α = 0.05 significance. Could you explain this question again and in more detail especially not in excel image
- A sales manager wants to examine the relationship between the number of daily customers (x) and the revenue generated (y). For this purpose, he made observations in a randomly chosen 6 days for a store and observed the number of daily customers and the revenue (1000 TL). The personally created data set for the x and y variables is included in the attached “Homework data” file. Using the data set defined on your behalf; x1 x2 x3 x4 x5 x6 y1 y2 y3 y4 y5 y6 sb1 Burak data 74 86 96 105 110 124 290 307 331 406 421 481 0.491 d) Establish and interpret the 95% confidence interval for β1.in 2019, investigators from brown university would like to determine the relationship of nail polish remover and ovarian cancer in women. a cohort of n-1000 beauticians aged 18-64 years old was identified and followed up after five years. after the follow-up period, there were x - 20 new cases of breast cancer were diagnosed. it is known that the incidence of ovarian cancer over the time period for average American women is 7/1000. the researchers wish to determine if the incidence computed in this study is equal to the incidence known in America at 0.01 level of significance.The test statistics to be used in problem b is ___ and the critical region was set at ____ a. t-test, 1.96b. z-test, 1.96c. z-test, 2.58ad. t-test, 2.58A popular fast food chain wants to open an outlet in a particular district. The research department collected some data from the district. Among the variables collected were i. the number of persons who buy gasoline during a particular period ii. the number of business places in the district iii. the types of businesses in the district iv. the area of land used for each house in the neighborhood v the days of late closing of the businesses vi the number of students from the two schools in the area who wait for the bus near the proposed site of the outlet. SELECT ALL THE QUALITATIVE VARIABLES