A study of IT companies has found the following data on the age of each company and its annual volume of sales: Age (years) Sales (000) 2 22 2.5 34 3 33 4 37 4.5 40 4.5 45 5 49 3 30 6 58 6.5 58 (a) Determine the least squares regression that relates the age of company variable to the sales variable in the form y = a + bx. (b) Provide a practical interpretation of the coefficients a and b. (c) Determine the ‘goodness of fit’ (R2) of the estimated regression line. d) Using the estimated regression line determined in (a), calculate what volume of sales would be predicted for a company that is 3.5 years of age. (e) If it was found that the distribution of sales has a right skew, describe what the implications would be for the R2 of the regression line relating sales to age. Explain how the R2 could be improved in this case.


Correlation
Correlation defines a relationship between two independent variables. It tells the degree to which variables move in relation to each other. When two sets of data are related to each other, there is a correlation between them.
Linear Correlation
A correlation is used to determine the relationships between numerical and categorical variables. In other words, it is an indicator of how things are connected to one another. The correlation analysis is the study of how variables are related.
Regression Analysis
Regression analysis is a statistical method in which it estimates the relationship between a dependent variable and one or more independent variable. In simple terms dependent variable is called as outcome variable and independent variable is called as predictors. Regression analysis is one of the methods to find the trends in data. The independent variable used in Regression analysis is named Predictor variable. It offers data of an associated dependent variable regarding a particular outcome.
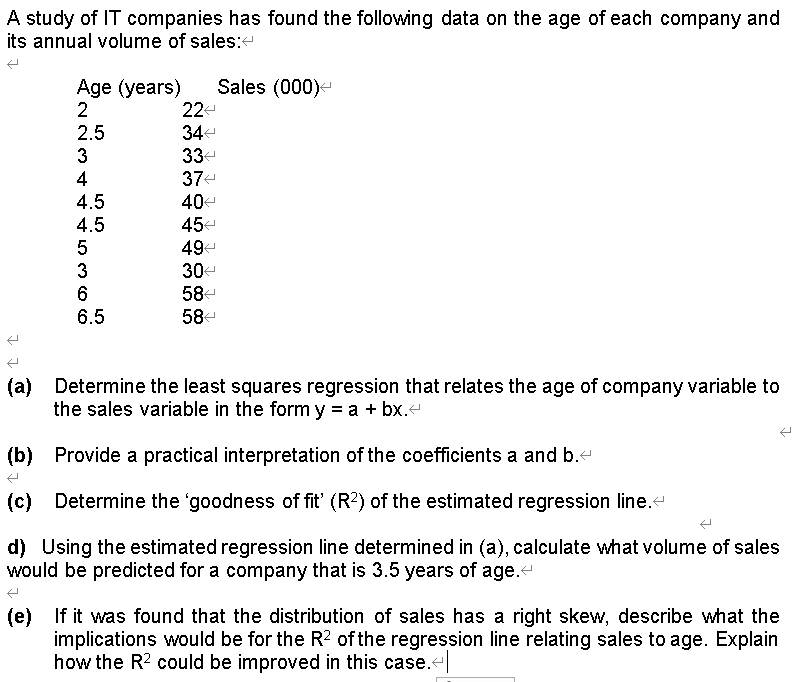
A study of IT companies has found the following data on the age of each company and its annual volume of sales:
Age (years) Sales (000)
2 22
2.5 34
3 33
4 37
4.5 40
4.5 45
5 49
3 30
6 58
6.5 58
(a) Determine the least squares regression that relates the age of company variable to the sales variable in the form y = a + bx.
(b) Provide a practical interpretation of the coefficients a and b.
(c) Determine the ‘goodness of fit’ (R2) of the estimated regression line.
d) Using the estimated regression line determined in (a), calculate what volume of sales would be predicted for a company that is 3.5 years of age.
(e) If it was found that the distribution of sales has a right skew, describe what the implications would be for the R2 of the regression line relating sales to age. Explain how the R2 could be improved in this case.

Step by step
Solved in 3 steps with 2 images


