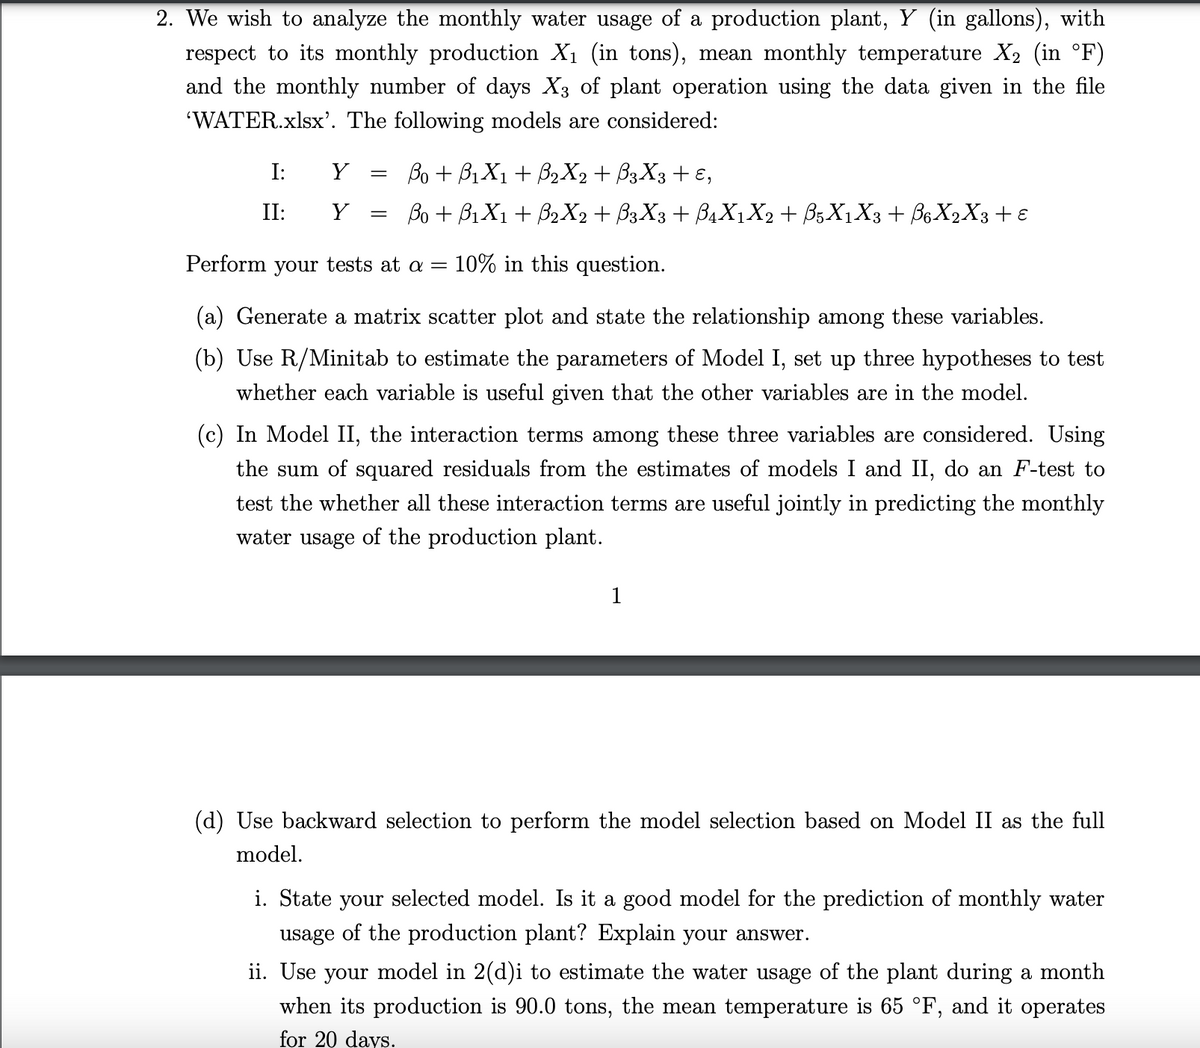
2. We wish to analyze the monthly water usage of a production plant, Y (in gallons), with respect to its monthly production X₁ (in tons), mean monthly temperature X₂ (in °F) and the monthly number of days X3 of plant operation using the data given in the file 'WATER.xlsx'. The following models are considered: I: II: Y Y = Bo + B1X1 + B₂X2 + B3X3 + E, Bo + B1X1 + B₂X2 + B3X3 + B₁X1X2 + B5X1X3 + B6X2 X3 + ε Perform your tests at a = 10% in this question.
2. We wish to analyze the monthly water usage of a production plant, Y (in gallons), with respect to its monthly production X₁ (in tons), mean monthly temperature X₂ (in °F) and the monthly number of days X3 of plant operation using the data given in the file 'WATER.xlsx'. The following models are considered: I: II: Y Y = Bo + B1X1 + B₂X2 + B3X3 + E, Bo + B1X1 + B₂X2 + B3X3 + B₁X1X2 + B5X1X3 + B6X2 X3 + ε Perform your tests at a = 10% in this question.

MATLAB: An Introduction with Applications
6th Edition
ISBN:9781119256830
Author:Amos Gilat
Publisher:Amos Gilat
Chapter1: Starting With Matlab
Section: Chapter Questions
Problem 1P

Related questions
Question
Transcribed Image Text:2. We wish to analyze the monthly water usage of a production plant, Y (in gallons), with
respect to its monthly production X₁ (in tons), mean monthly temperature X₂ (in °F)
and the monthly number of days X3 of plant operation using the data given in the file
'WATER.xlsx'. The following models are considered:
I:
II:
Y =
Y =
Bo + B₁X₁ + B₂X2 + ß3X3 + E,
Bo + B₁X₁ + B2X2 + B3X3 + B₁X1X2 + B5X₁X3 + B6X2X3 + ε
Perform your tests at a = 10% in this question.
(a) Generate a matrix scatter plot and state the relationship among these variables.
(b) Use R/Minitab to estimate the parameters of Model I, set up three hypotheses to test
whether each variable is useful given that the other variables are in the model.
(c) In Model II, the interaction terms among these three variables are considered. Using
the sum of squared residuals from the estimates of models I and II, do an F-test to
test the whether all these interaction terms are useful jointly in predicting the monthly
water usage of the production plant.
1
(d) Use backward selection to perform the model selection based on Model II as the full
model.
i. State your selected model. Is it a good model for the prediction of monthly water
usage of the production plant? Explain your answer.
ii. Use your model in 2(d)i to estimate the water usage of the plant during a month
when its production is 90.0 tons, the mean temperature is 65 °F, and it operates
for 20 days.
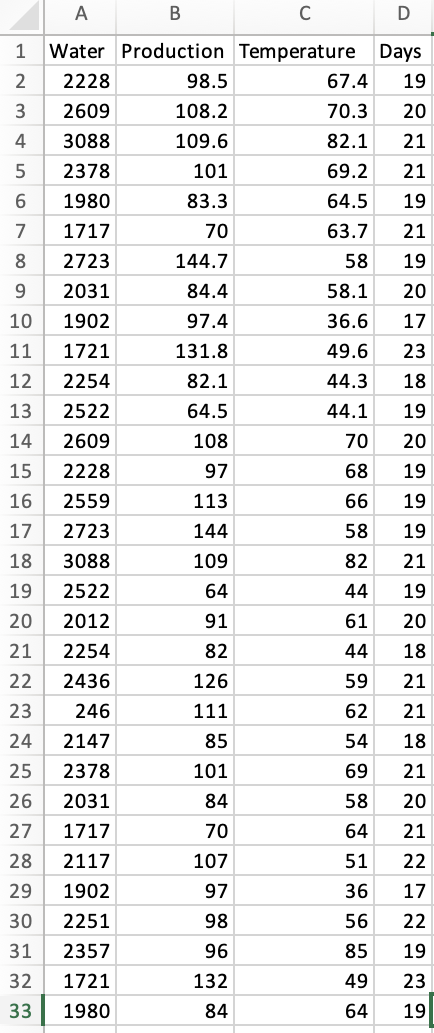
Transcribed Image Text:A
B
Water Production
2228
2609
3088
5
2378
6
1980
7
1717
8 2723
9 2031
10 1902
11 1721
123+
4
12
2254
13 2522
14
2609
15
2228
16
2559
17 2723
18 3088
19 2522
20 2012
21
2254
22 2436
23
246
24
2147
25
2378
26
2031
27
1717
28 2117
29 1902
30 2251
31 2357
32
1721
33
1980
98.5
108.2
109.6
101
83.3
70
144.7
84.4
97.4
131.8
82.1
64.5
108
97
113
144
109
64
91
82
126
111
85
101
84
70
107
97
98
96
132
84
D
Days
67.4
19
70.3
20
82.1
21
69.2
21
64.5 19
63.7 21
58 19
20
17
23
18
44.1 19
70
20
68
Temperature
58.1
36.6
49.6
44.3
66
58
82
44
61
44
59
62
1999903aa13
21
20
18
21
21
54
18
69
21
58
20
64
21
51 22
36
17
56 22
85 19
49 23
64 19
Expert Solution
This question has been solved!
Explore an expertly crafted, step-by-step solution for a thorough understanding of key concepts.

Step by step
Solved in 5 steps with 6 images

Recommended textbooks for you
MATLAB: An Introduction with Applications
Statistics
ISBN:
9781119256830
Author:
Amos Gilat
Publisher:
John Wiley & Sons Inc

Probability and Statistics for Engineering and th…
Statistics
ISBN:
9781305251809
Author:
Jay L. Devore
Publisher:
Cengage Learning

Statistics for The Behavioral Sciences (MindTap C…
Statistics
ISBN:
9781305504912
Author:
Frederick J Gravetter, Larry B. Wallnau
Publisher:
Cengage Learning
MATLAB: An Introduction with Applications
Statistics
ISBN:
9781119256830
Author:
Amos Gilat
Publisher:
John Wiley & Sons Inc
Probability and Statistics for Engineering and th…
Statistics
ISBN:
9781305251809
Author:
Jay L. Devore
Publisher:
Cengage Learning
Statistics for The Behavioral Sciences (MindTap C…
Statistics
ISBN:
9781305504912
Author:
Frederick J Gravetter, Larry B. Wallnau
Publisher:
Cengage Learning

Elementary Statistics: Picturing the World (7th E…
Statistics
ISBN:
9780134683416
Author:
Ron Larson, Betsy Farber
Publisher:
PEARSON

The Basic Practice of Statistics
Statistics
ISBN:
9781319042578
Author:
David S. Moore, William I. Notz, Michael A. Fligner
Publisher:
W. H. Freeman

Introduction to the Practice of Statistics
Statistics
ISBN:
9781319013387
Author:
David S. Moore, George P. McCabe, Bruce A. Craig
Publisher:
W. H. Freeman