Complete the following graph by labeling each bar (a-e) with a cause of extinction, from the most influential to the least influential. а. b. C. d. е. O 20 40 60 80 100 % Species Affected by Threat
Complete the following graph by labeling each bar (a-e) with a cause of extinction, from the most influential to the least influential. а. b. C. d. е. O 20 40 60 80 100 % Species Affected by Threat

Concepts of Biology
1st Edition
ISBN:9781938168116
Author:Samantha Fowler, Rebecca Roush, James Wise
Publisher:Samantha Fowler, Rebecca Roush, James Wise
Chapter19: Population And Community Ecology
Section: Chapter Questions
Problem 4RQ: Which of the following methods will provide information to an ecologist about both the size and...

Related questions

Question
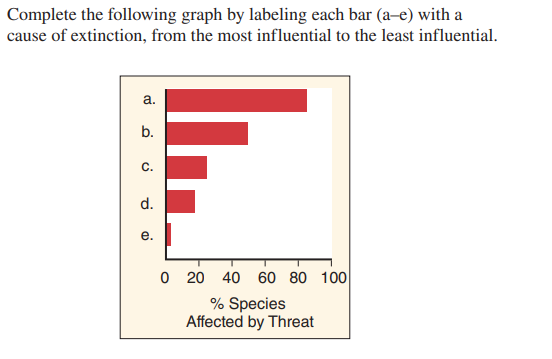
Transcribed Image Text:Complete the following graph by labeling each bar (a-e) with a
cause of extinction, from the most influential to the least influential.
а.
b.
C.
d.
е.
O 20 40 60 80 100
% Species
Affected by Threat
Expert Solution
This question has been solved!
Explore an expertly crafted, step-by-step solution for a thorough understanding of key concepts.

Step by step
Solved in 2 steps

Knowledge Booster


Learn more about
Need a deep-dive on the concept behind this application? Look no further. Learn more about this topic, biology and related others by exploring similar questions and additional content below.Recommended textbooks for you
Concepts of Biology
Biology
ISBN:
9781938168116
Author:
Samantha Fowler, Rebecca Roush, James Wise
Publisher:
OpenStax College
Concepts of Biology
Biology
ISBN:
9781938168116
Author:
Samantha Fowler, Rebecca Roush, James Wise
Publisher:
OpenStax College