Complete the ollowing table to whether Kenji is correct. Price Quantity Demanded Total Revenue Total Cost Profit (Dollars per can) (Cans) (Dollars) (Dollars) (Dollars) 2.75 3.00 Given the earlier information, Kenji correct in his assertion that BYOB should charge $3.00 per can. Suppose that a technological innovation decreases BYOB's costs so that it now faces the marginal cost (MC) and average total cost (ATC) given on the following graph. Specifically, the technological innovation causes a decrease in average fixed costs, thereby lowering the ATC curve and moving the MC curve. Place the black point (plus symbol) on the following graph to indicate the profit-maximizing price and quantity for BYOB. If BYOB is making a profit, use the green rectangle (triangle symbols) to shade in the area representing its profit. On the other hand, if BYOB is suffering a loss, use the purple rectangle (diamond symbols) to shade in the area representing the loss. 4.00 3.50 Monopoly Outcome 3.00 2.50 Profit 2.00 ATO 1.50 Loss 1.00 0.50 MC D MR 0.5 1.0 1.5 2.0 2.5 3.0 3.5 4.0 QUANTITY (Thousands of cans of beer) PRICE (Dollars per can)
Complete the ollowing table to whether Kenji is correct. Price Quantity Demanded Total Revenue Total Cost Profit (Dollars per can) (Cans) (Dollars) (Dollars) (Dollars) 2.75 3.00 Given the earlier information, Kenji correct in his assertion that BYOB should charge $3.00 per can. Suppose that a technological innovation decreases BYOB's costs so that it now faces the marginal cost (MC) and average total cost (ATC) given on the following graph. Specifically, the technological innovation causes a decrease in average fixed costs, thereby lowering the ATC curve and moving the MC curve. Place the black point (plus symbol) on the following graph to indicate the profit-maximizing price and quantity for BYOB. If BYOB is making a profit, use the green rectangle (triangle symbols) to shade in the area representing its profit. On the other hand, if BYOB is suffering a loss, use the purple rectangle (diamond symbols) to shade in the area representing the loss. 4.00 3.50 Monopoly Outcome 3.00 2.50 Profit 2.00 ATO 1.50 Loss 1.00 0.50 MC D MR 0.5 1.0 1.5 2.0 2.5 3.0 3.5 4.0 QUANTITY (Thousands of cans of beer) PRICE (Dollars per can)

Chapter15: Imperfect Competition
Section: Chapter Questions
Problem 15.2P

Related questions
Question
please do the graphs and the questions
thank youuuuu
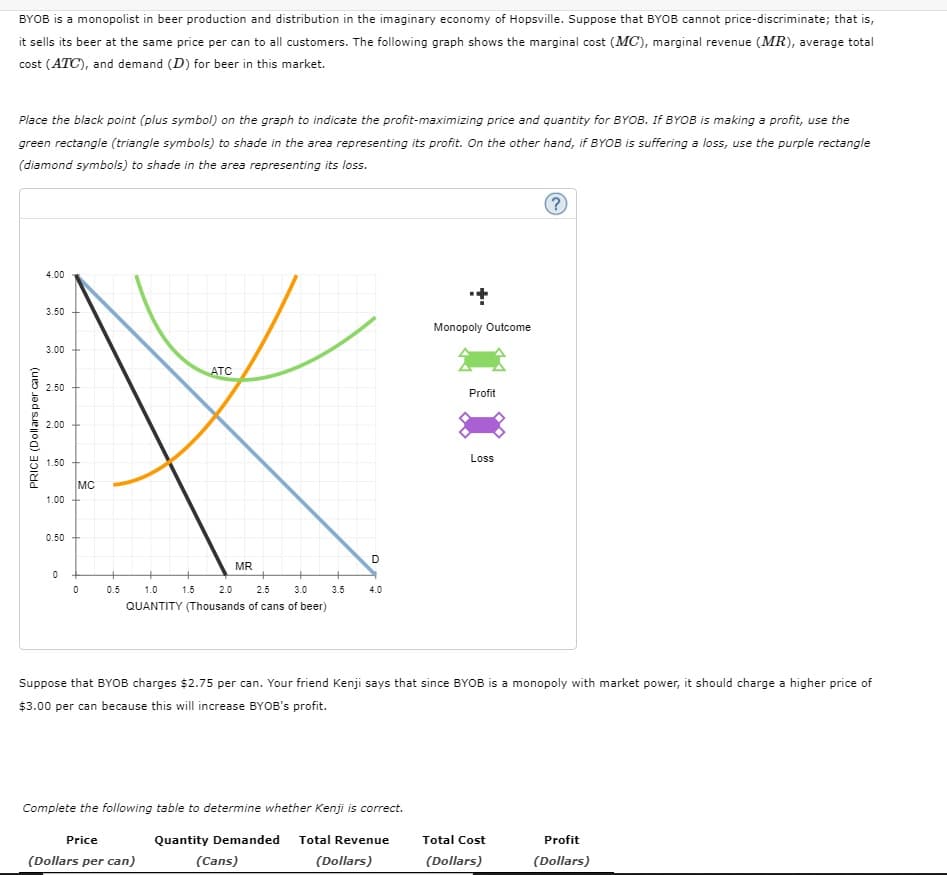
Transcribed Image Text:BYOB is a monopolist in beer production and distribution in the imaginary economy of Hopsville. Suppose that BYOB cannot price-discriminate; that is,
it sells its beer at the same price per can to all customers. The following graph shows the marginal cost (MC), marginal revenue (MR), average total
cost (ATC), and demand (D) for beer in this market.
Place the black point (plus symbol) on the graph to indicate the profit-maximizing price and quantity for BYOB. If BYOB is making a profit, use the
green rectangle (triangle symbols) to shade in the area representing its profit. On the other hand, if BYOB is suffering a loss, use the purple rectangle
(diamond symbols) to shade in the area representing its loss.
4.00
3.50
Monopoly Outcome
3.00
ATC
2.50
Profit
2.00
Loss
1.50 +
MC
1.00
0.50
D
MR
0.5
1.0
1.5
2.0
2.5
3.0
3.5
4.0
QUANTITY (Thousands of cans of beer)
Suppose that BYOB charges $2.75 per can. Your friend Kenji says that since BYOB is a monopoly with market power, it should charge a higher price of
$3.00 per can because this will increase BYOB's profit.
Complete the following table to determine whether Kenji is correct.
Price
Quantity Demanded Total Revenue
Total Cost
Profit
(Dollars per can)
(Cans)
(Dollars)
(Dollars)
(Dollars)
PRICE (Dollars per can)
Transcribed Image Text:Complete the following table to determine whether Kenji is correct.
Price
Quantity Demanded
Total Revenue
Total Cost
Profit
(Dollars per can)
(Cans)
(Dollars)
(Dollars)
(Dollars)
2.75
3.00
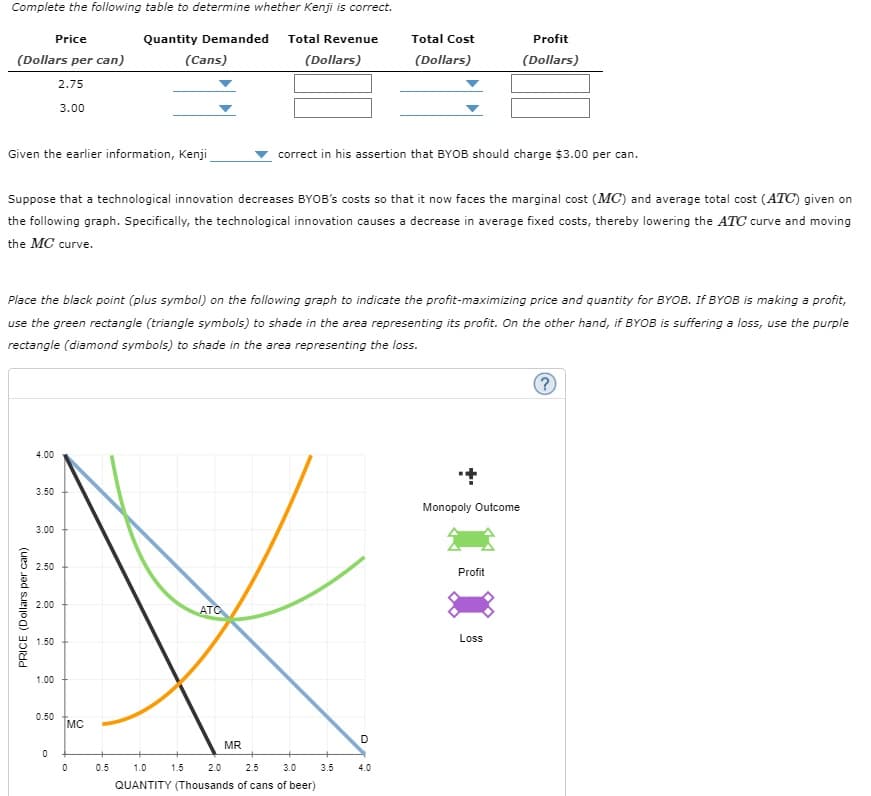
Given the earlier information, Kenji
correct in his assertion that BYOB should charge $3.00 per can.
Suppose that a technological innovation decreases BYOB's costs so that it now faces the marginal cost (MC) and average total cost (ATC) given on
the following graph. Specifically, the technological innovation causes a decrease in average fixed costs, thereby lowering the ATC curve and moving
the MC curve.
Place the black point (plus symbol) on the following graph to indicate the profit-maximizing price and quantity for BYOB. If BYOB is making a profit,
use the green rectangle (triangle symbols) to shade in the area representing its profit. On the other hand, if BYOB is suffering a loss, use the purple
rectangle (diamond symbols) to shade in the area representing the loss.
4.00
3.50
Monopoly Outcome
3.00
2.50
Profit
2.00
ATO
Loss
1.50
1.00
0.50
MC
D
MR
0.5
1.0
1.5
2.0
2.5
3.0
3.5
4.0
QUANTITY (Thousands of cans of beer)
PRICE (Dollars per can)
Expert Solution
This question has been solved!
Explore an expertly crafted, step-by-step solution for a thorough understanding of key concepts.

This is a popular solution!

Trending now
This is a popular solution!

Step by step
Solved in 3 steps with 2 images

Knowledge Booster


Learn more about
Need a deep-dive on the concept behind this application? Look no further. Learn more about this topic, economics and related others by exploring similar questions and additional content below.Recommended textbooks for you


Managerial Economics: Applications, Strategies an…
Economics
ISBN:
9781305506381
Author:
James R. McGuigan, R. Charles Moyer, Frederick H.deB. Harris
Publisher:
Cengage Learning

Economics: Private and Public Choice (MindTap Cou…
Economics
ISBN:
9781305506725
Author:
James D. Gwartney, Richard L. Stroup, Russell S. Sobel, David A. Macpherson
Publisher:
Cengage Learning