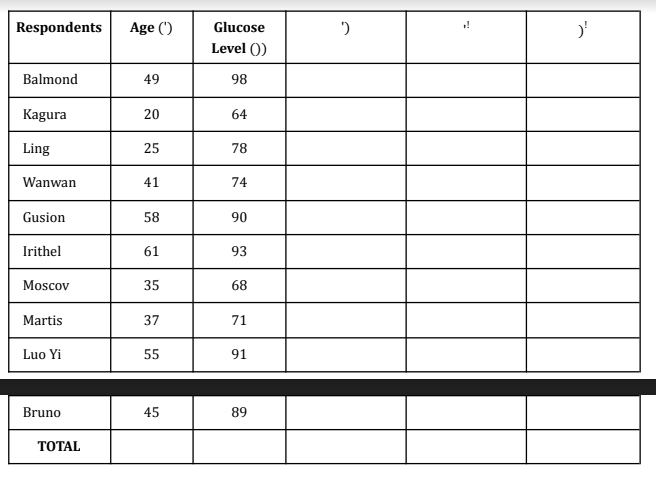
complete the table below, show your complete solution. The data in the table was gathered from a survey with 10 respondents Answer the following: 1. compute for the value of pearson's * 2. interpret the value of *


Q: find the 95% confidence interval to estimate the proportion of CCC adults that favor a ban on…
A: Here Given Sample Size=n=100 Proportion of adults supports ban on assault-style weapons=p^=0.62
Q: A sample of n = 10 scores has M = 58, s = 12.65, and an estimated standard error of 4 points. Which…
A: The sample size n is 10, the standard deviation is 12.65 and the standard error is 4.
Q: A1 A2 A3 A4 B1 13 3 B2 4 11 B3 7 3 10 4 B4 8 Use values from the contingency table to calculate the…
A:
Q: 3) An oceanographer believes the median wave height off of South Florida's coast is equal to 1.9…
A:
Q: Suppose that the weights of cats are normally distributed with an unknown mean and a standard…
A:
Q: A company institutes an exercise break for workers to see if it will improve job satisfaction.…
A: here use basic of hypothesis test selection
Q: 7.96 Caffeine content of coffee. According to a Food and Drug Administration (FDA) study, a cup of…
A:
Q: People in a city are going to vote for one of the three candidates A, B, and C in the next election.…
A: Candidates : A, B, C Total voters : 100 A:35 B:28 C:37 We have to tell, it is significant or not.
Q: Theorem;- Sample mean is unboise estimate of POpulation mean in poission distribution CS Scanned…
A: In question, We'll prove that sample mean is unbiased estimator of population mean for Poisson…
Q: x-2 If x-N(2,4), then 2 (1) 2.
A: Given that : μ = 2 ? 2 = 4 X ~N ( 2 , 4 ) By using normal distribution property we solve this…
Q: Students in a class were divided in two batches of 10. One batch was given a quiz in the morning…
A: Solution: The given data is
Q: 2. Income is not normally distributed; instead, it is skewed right. This is because there are a few…
A: Given μ=$73,000σ=$28,000Medain=$61,000 Find a,b and c parts
Q: find the area under the standard normal curve to the left of the given z-value z=3.57
A: We will use Std. Normal table to find the required area.
Q: Question 13 The claim is a mean is 212 and you want to prove it is more. Test the hypothesis within…
A: According to the given information in this question Given Test statistic = 0.26 Decision = 1.8
Q: . Using part b to guide you, use @RISK to find the probability that a random number from this…
A:
Q: What is the class width of the frequency distribution? Office salaries Frequency $35,000-$47,999…
A: We have given that the frequency distribution table.
Q: A research team is working on a project to study the time (in seconds) for high school male runners…
A: As per our guidelines we can solve first three sub part of question and rest can be reposted.…
Q: it is unbaised estimated of a Then Show That ta is baised estimated of O2.
A:
Q: what is the predicted value of the dependent variable when the independent variable has value 140?
A: We have given that the line of best fit through a set of data is, y = 21.974 + 1.021x
Q: Suppose that 65% of people who enter a store will make a purchase. Random samples of people who walk…
A:
Q: 8) In one season with the Miami Heats, LeBron James made 80% of his free- throws. Suppose that we…
A:
Q: Suppose that in a large population of students, the mean amount of sleep the previous night was u =…
A: Note: According to Bartleby expert guidelines, we can answer only first question with their three…
Q: What is the lower outlier if Q1 is 54 and Q3 is 160?
A: Given that, first quartile, Q1 = 54 Third quartile, Q3 = 160 We need to find the lower outlier.
Q: zscore for 0.5967.
A: Here We will Use Excel command for z score
Q: technology company is forming a task force of six members to deal with urgent quality issues. The…
A:
Q: the study, n = 52 men were put on a diet. The men who dieted lost an average of 6.0 kg, with a…
A: Given that ; Sample size (n) = 52 Sample mean = 6.0 kg ? = 3.7 kg By using one sample mean test we…
Q: Globally, 35% of all ridged brittleshell tortoises have spots on their shells. A herpetologist in…
A: According to guidelines we solve first question only when given questions are different.
Q: which estate had the greatest amount of people?
A: here use given graph
Q: Given that x is a normal variable with mean ? = 109 and standard deviation ? = 10, find the…
A:
Q: The number of reviews for each of the local restaurants is counted. The results are normally…
A:
Q: 2. Let X,, X,.., x, be a random sample from a distribution with p.d.f. f(x;0) =0 x, T>x>0 Is the MLE…
A: Given that We have to find the MLE of theta
Q: A manufacturer is interested at the output voltage of a power supply for the laptop. Output voltage…
A: In statistical hypothesis testing, a test statistic is a number calculated from the values of the…
Q: Official Cancun Airp. C THE SWITCH HAS B. d. The p-value = (Please show your answer to 4 decimal…
A: Given that Sample size n =41 Sample mean =4.16 Standard deviation =0.8 NOTE:- According to bartleby…
Q: Congress is comprised of the House of Representatives and the Senate. Suppose that 21% are female…
A:
Q: A college instructor teaching a HyFlex class needs to schedule a classroom for an exam.…
A:
Q: 1. If X,, X2, .X, forms a random sample of size n from a population with pdf f(x; 8,8) = 0 for x>0…
A:
Q: The claim is a mean is 222 and you want to prove it is less. Test the hypothesis within a 10% level…
A: Given information Mean ( mu ) = 222 Sample mean (xbar) = 213.12 Standard deviation (s) =79.92…
Q: According to the following two way table, what percentage of people in the sample is taking naps.…
A: Solution-: We have following table: Male Female Take naps 25 30 Does not take naps 35 10…
Q: A sub sandwich shops offer 16 toppings to choose from. How many ways could a person person choose 3…
A: Combination formula : Number of ways to select r subjects from total n subjects is , Crn =…
Q: Express the confidence interval 481.5 ± 118.1 in the form of a trilinear inequality. < µ <
A:
Q: d.Circle a confidence interval that does not accurately estimate the population proportion. Why…
A: Confidence interval A confidence interval is a range of estimates for an unknown parameter. A…
Q: A random sample of 860 births in a state included 429 boys. Construct a 95% confidence interval…
A: Solution-: Given: X=429,n=860, c=0.95 We construct a 95% C.I. estimate of the proportion of boys in…
Q: 1. If X,X2, ..X, forms a random sample of size n from a population with pdf 0 for x>0 f(x; 0,8) =…
A:
Q: The city council of Pine Bluffs Is considering Increasing the number of police In an effort to…
A: For the given data Find the required blanks
Q: A teacher tracked how many minutes each student in his class spent on the unit project and created a…
A: A histogram is given and find the number of students
Q: The following data represent the number of days absent per year in a population of six employees of…
A: We have given data are 1,3,5,6,7,10 Mean for the given data is µ = ∑x/n = (1+3+5+6+7+10)/6 = 5.33
Q: 3. Construct a probability distribution for X. 4. Find the mean and variance of X.
A: here use given population with data 1,3,5,7 N=4 n= 2 here total possible sample of size 2 with…
Q: The jump heights of 32 students are displayed i the box plot Vertical Jump Heights 30 40 50 60 70 80…
A:
Q: I. Word Problem. Ilustrate the given situation in a Venn diagram and answer the following questions.…
A: Given that Total initial items=100 Note: According to bartleby experts question answers guidelines…
complete the table below, show your complete solution. The data in the table was gathered from a survey with 10 respondents
1. compute for the value of pearson's *

Step by step
Solved in 3 steps with 2 images

- Your place of employment is trying to determine whether to allow its employees to work from home for2 days a week. Knowing that you’ve previously taken a statistics course, your boss asks you to “figure itout”. You create a survey to gauge employee interest in this area.1. Formerly, your place of employment has tried to give surveys to everyone, a census, but only a fewpeople responded to the email. Your new plan is to randomly choose some employees and administerthe survey yourself. You put everyone’s name on a numbered list and randomly choose numbers untilyou have your sample. What form of sampling is being described here?2. Suppose you want to estimate the percentage of employees who want to work from home. Doingsome research on the internet, you find a recent study that found that 72% of employees prefer a hybridremote-office model. Using that value as your sample proportion, ?̂, estimate how many people youwould need to survey in order to estimate the percentage in your company…A lawyer received a complaint from a representative for factory workers somewhere in Pampanga. The workers were being forced to work for more than 8 hours. 8 hours is the average/normal work time per day in the Philippines as stated in the Labor Code and was initially stipulated by their employer when they were hired. They also reported that they were not receiving any compensation for their overtime work. The lawyer commissioned you to conduct a survey involving 10 randomly selected workers from the factory to inquire about their work time. The data you collected is displayed below. 8 hours 6 hours 5 hours 10 hours 14 hours 3 hours 9 hours 8 hours 11 hours 14 hours Use the P-Value Approach in testing the complaint of the workers. 1) Estimate μ at 99% confidence interval. 2) If you drew the wrong conclusion and gave the labor lawyer the wrong advice, what type of error would you have committed?A study was recently conducted to assess the relationship between miscarriage and heavy alcohol use during the first trimester of pregnancy. Fifty women who suffered miscarriage were enrolled in the study along with 50 women who delivered full-term infants. Each participant’s use of alcohol during their first trimester of pregnancy was ascertained by face-to-face interview. For the purpose of this study, heavy alcohol use was defined as consuming four or more drinks on any one occasion during the first trimester of pregnancy. Study results found that a total of 18 women were heavy alcohol users, 14 among those who suffered a miscarriage. 1) What type of study design was used? Explain. 2) Set up the 2X2 contingency table for the data. 3) For this type of study design, what is the appropriate measure to describe the strength of the association between exposure and disease? 4) Calculate the measure identified in question 3. 5) Interpret the measure calculated in question 4. A recent study…
- A study was recently conducted to assess the relationship between miscarriage and heavy alcohol use during the first trimester of pregnancy Fifty women who suffered miscarriage were enrolled in the study along with 50 women who delivered full-term infants . Each participant's use of alcohol during their first trimester of pregnancy was ascertained by face-to- face interview. For the purpose of this study, heavy alcohol use was defined as consuming four or more drinks on any one occasion during the first trimester of pregnancy . Study results found that a total of 18 women were heavy alcohol users, 14 among those who suffered a miscarriage . a. What type of study design was used? B. What is the appropriate measure to describe the strength of the association between the exposure and the disease? c. Calculate the measure identified in question B d. Interpret the measure calculated in question CA researcher wishes to assess the possibility that a certain type of psychotherapy actually reduces neurotic symptoms. A random sample of subjects is selected from the population of names on a waiting list at a mental health clinic. For each subject selected, another subject is so, also from the waiting list, who resembles the original deselect exception in a number of important respects, such as age, length of time on the waiting list, IQ, severity of symptoms, length of symptoms duration, category of neurosis, and previous treatment history. By a flip of a coin, one group is chosen to receive six months of intensive Psychotherapy, while the other group is told to continued waiting and not to seek treatment elsewhere. At the end of the six-month period, a panel of expert judges all the subjects with respect to the extent of symptomatology. What type of research is this, experimental or post facto? What is the IV and what is the DV? What would you advise the researcher to do with…2. A study was conducted to determine the level of awareness of the residents of a certain municipality on the causes of hypertension. The accompanying table shows the results with respect to the gender of the respondents.
- A company claims that its new viral vaccine is at least 90% effective in preventing a contagious viral disease. Suppose that in a clinical trial with 3000 respondents, 2640 did not get infected by this disease. At 1% level of significance, Is the claim of the company valid or not valid?The 1958 Detroit Area Study was an important investigation of the influence of religion on everyday life. The sample, "was basically a simple random sample of the population of the metropolitan area" of Detroit, Michigan. Of the 662 respondents, 276 were white Protestants and 224 were white Catholics. The study took place at the height of the cold war. One question asked if the right of free speech included the right to make speeches in favor of communism. Of the 276 white Protestants, 118 said "Yes" while 88 of the 224 white Catholics said "Yes." Give a 80% confidence interval for the difference between the proportion of Protestants who agreed that communist speeches are protected and the proportion of Catholics who held this opinion. Follow the Inference Toolbox. lower bound: upper bound:4. A pharmaceutical company wants to test whether the incidence of side effects (i.e. adverse events)differs between the treatment and placebo groups at theα= 0.05. Letp1= the proportion of subjects in the treatment groups who experienced at least one adverse event and letp2= the proportion of subjects in the placebo group who experience at least one adverse event. 8 out of 30 people in the treatment group experienced at least one adverse event and 5 out of 30 people in the placebo group experienced at least one adverse event. (a) Set up the null and alternative hypothesis (using mathematical notation/numbers AND interpret them in the context of the problem) (b) Calculate the test statistic (c) Calculate the critical value (d) Draw a picture of the distribution of the test statistic under H0. Label and provide values for the critical value and the test statistic, and shade the critical region. (e) Make and justify a statistical decision at theα= 0.05 level and state your conclusions in…
- A researcher wants to know if people from different social classes (lower, working, middle, upper classes) vary in their support for same-sex marriage. The researcher measured the attitudes of people from different social classes toward same-sex marriage by asking if they think homosexuals should have right to marry (1=strongly disagree, 2=disagree, 3=agree, 4=strongly agree). The researcher hypothesized that social classes will vary significantly in their support for same-sex marriage. To test the hypothesis, the researcher conducted a one-way ANOVA and obtained the following results. ANOVA HOMOSEXUALS SHOULD HAVE RIGHT TO MARRY Sum of Squares df Mean Square F Sig. Between Groups 3.544 3 1.181 .496 .685 Within Groups 2202.349 924 2.383 Total 2205.892 927 Based on the results in the table above, can the researcher conclude that his hypothesis is supported and that there is a significant difference…A researcher wishes to examine the impact that smoking has on the risk of getting lung cancer in Town X. Town X has a population of 500,000 people, of which 5,780 people have lung cancer, whilst the rest do not. He randomly sampled 10% of the people with lung cancer and 20% of the people without lung cancer and enquires about their smoking history. From here we assume the following The number of people with lung cancer is accurate and known to the researcher. All the sampled participants agreed to participate in the researcher’s study. All participants gave truthful responses regarding their smoking history. The results are summarized in the contingency table below. Lung cancer No lung cancer Row total Smokers 457 20,246 20,703 Non-smokers 121 78,598 78,719 Column total 578 98,844 99,422 Based on the above scenario, which of the following statements is/are true? (I) The sample risk ratio of lung cancer between smokers and…1. Peripheral catheters retained in a blood vessel are a common cause of peripheral vascular catheter-related bloodstream infections (PVC-BSIs) (Sato et al. 2017). Patients with PVC-BSIs appear to also have other infections such as Staphylococcus aureus (S. aureus). Researchers want to know if having an S. aureus infection is associated with dying from a PVC-BSI. In a recent trial, 187 patients were studied. 76 patients that had an S. aureus infection also died of a PVC-BSI. 35 patients died of a PVC-BSI but did not have an S. aureus infection. 22 patients had an S. Aureus infection but did not die of a PVC-BSI. Finally, 54 patients did not have an S. aureus infection and did not die of a PVC-BSI. Test the claim that PVC-BSI mortality is dependent upon having an S. aureus infection. Use a 0.05 significance level. a. 0.31 b. 0.45 c. 3.94 d. 2.14 e. 4.54


