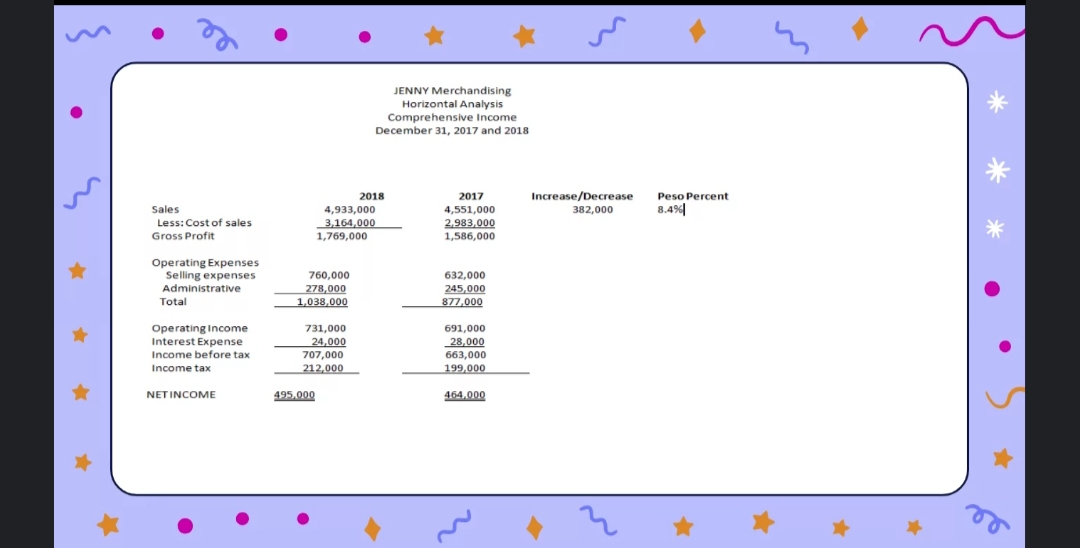
Comprehensive Income December 31, 2017 and 2018 2017 4,551,000 Increase/Decrease Peso Percent 2018 382,000 8.4 Sales 4,933,000 Less: Cost of sales Gross Profit 3,164,000 1,769,000 2.983.000 1,586,000 Operating Expenses Selling expenses Administrative 760,000 632,000 278,000 1,038.000 245,000 877,000 Total Operating income Interest Expense Income before tax 731,000 691,000 24,000 707,000 28,000 663,000 Income tax 212,000 199,000 NET INCOME 495.000 464.000


Q: Jaran Enterprises Income Statement For the year ended December 31, 2021 Sales Less: Cost of Sales…
A: Ratio analysis means where the various ratio can be found out with different name and meaning and…
Q: Forecasting an Income Statement AutoZone Inc. reports the following income statements. Consolidated…
A:
Q: Income Statement Dec. 31, 2022 Company A Company B Sales P850,000 P1,350,000 Less: Cost of Goods…
A: Efficiency in the management of stock is judged by inventory turnover ratio and days inventory…
Q: Declan's Designs Balance Sheet Declan's Designs Income Statement ASSETS Current Assets For the Year…
A: The dividend is declared to the shareholders from the retained earnings of the business.
Q: LOGIC COMPANY Comparative Income Statement For Years Ended December 31, 2017 and 2018…
A: Accounts receivable is the amount that has been earned by the company but the payment for the same…
Q: The following data relate to Alpha Company: 2018 2017 P500,000 P400,000 240,000 200,000 Sales Cost…
A: Comparative Financial statements or also called horizontal analysis are used to compare the item of…
Q: LOGIC COMPANY Comparative Income Statement For Years Ended December 31, 2017 and 2018…
A: What is meant by ratio analysis? An analysis of the financial statement carried out to have an…
Q: LOGIC COMPANY Comparative Income Statement For Years Ended December 31, 2017 and 2018…
A: Ratio analysis means where different ratio of various years of years companies has been compared and…
Q: Stack Technologies Income Statement For the year ended December 31, 2021 Net Sales $405,000 Expenses…
A: The Statement of Cash Flows, one of the four required financial statements by GAAP, details the…
Q: 2019 2018 Revenue 28,433,361 28,264,711 Cost of sales (23,661,338) (27,476,274) Gross Profit…
A: Activity ratio measures the business efficiency and manages the company's resources to generate…
Q: LOGIC COMPANY Comparative Income Statement For Years Ended December 31, 2017 and 2018…
A: What is meant by ratio analysis? An analysis of the financial statement carried out to have an…
Q: Selected assumptions for 2018 Sales growth rate 9 % Cost of goods sold/Sales 62 % Dividends/Net…
A: According to the data, The sales projected for 2018 would be the Sale of 2017 + the increase in…
Q: KORBIN COMPANY Comparative Income Statements For Years Ended December 31, 2019, 2018, and 2017…
A: Solution: Korbin Company Balance sheet data in Trend Percent Dec 31, 2021, 2020 and 2019…
Q: BALANCE SHEET INCOME STATEMENT Current Assets: 2017 2018 2018 Cash $ 143,000 $ 154,775 $ 178,000 $…
A: Free cash Flows refers to Net cash flow from Operating Activities less Capital Expenditure. It is…
Q: Income Statement (Extract) for the year ended 31 March 2018 2019 £ £ Sales 3,000,000…
A: Financial ratio is an arithmetic expression used to describe the significant relationship between…
Q: Net profit margin Gross profit margin Current ratio
A: As per the guidelines only three subparts are allowed to be solved. Please upload the questions…
Q: T. P. Jarmon Company, Income Statement for the Year Ended 12/31/2018 Sales (all credit) $ 600,000…
A: It is the summary statement that shows the cash and cash equivalent's inflow and outflow as a result…
Q: Storme Imports Company (SIC) Tax Rate COMPARITIVE INCOME STATEMENT 30% for years ended 31…
A: In the given question we are provided with the financial data for the year 2018. On that basis, we…
Q: (In millions) 2019 2018 2017 Revenue $9,575 $9,300 $8,975 cost of goods sold $6,250 $6,000…
A: Horizontal analysis of the financial statements determines the changes of a particular item over the…
Q: Sales $2,100 (50% of average assets)ª Costs 1,050 (50% of sales) Interest 20 (38 of debt at start of…
A: Income statement is also called profit or loss a/c. Income statement shows the performance of the…
Q: Compantieincome staerements years end dec 31, 2018 and 2on Net sales Costs of goods sold gross…
A: Average total assets = (beginning total assets + ending total assets )/2 Average total assets for…
Q: Retained earnings Total liabilities and stockholders' equity 410,000 $1,000,000 MARNI COMPANY Income…
A: fixed charge coverage ratio formula: fixed charge coverage ratio = (EBIT + lease) / ( interest +…
Q: ounts payable turnover and days' payable outstanding (DPO) for 2017 and 2018. tio 20400 Data Table…
A: Ratio analysis is a method of measuring the financial position of the organization with different…
Q: STATEMENT OF COMPREHENSIVE INCOME FOR THE YEAR ENDED DECEMBER 31 2020 2019 2018 Turnover…
A: Financial Ratios There are different types of financial ratios. These ratios are used to evaluate…
Q: (Comprehensive Income) Roxanne Carter Corporation reported the following for 2017: net sales…
A: a.
Q: For Year 2015 and 2016 2016 2015 et Sales ess Cost of Goods Sold Gross Profit ess Operating Expenses…
A: Time interest ratio indicates ability of the firm to pay interest on the time. It can be found out…
Q: STATEMENT OF PROFIT AND LOSS PT UHUY FOR THE YEAR ENDED 31ST DECEMBER 2019 Sales 1,246,000 Cost of…
A: Statement of cash flowsFor the year December 31, 2019 Cash flow from operating activities:…
Q: LOGIC COMPANY Comparative Income Statement For Years Ended December 31, 2017 and 2018 2018 2017…
A: The acid-test ratio is calculated by dividing the liquid assets of the company by its current…
Q: LOGIC COMPANY Comparative Income Statement For Years Ended December 31, 2017 and 2018…
A: Asset Turnover Ratio: A company's asset turnover ratio is a measure of the efficiency with which its…
Q: Annual Percentage Growth 2015-2016
A: Annual Percentage Growth and Change for 2015-2016 is given below,
Q: e 2021 Income statement of Adrian Express reports sales of $16,932,000, cost of goods sold of $10,…
A: Current ratio is calculated by dividing the current assets by current liabilities.
Q: TREN Corporation Comparative Income Statements For the years ended December 31, 2015 & 2014 (in…
A: Horizontal analysis compares last year numbers with current year numbers and analysis of increase…
Q: Presented below are excerpts from the income statements of Gloo Company for the years ended December…
A: The Sales , Cost of goods sold and gross profit for year 2019 and 2020 are given. Required Analyze…
Q: ZEUS COMPANY COMPARATIVE INCOME STATEMENT For the years 2019 and 2018 2019 2018 Rate of Inc(Dec)…
A: The income statement is prepared to find the net income or loss incurred during the period.
Q: Calculate the current ratio. (Round your answers to the nearest hundredth.) Calculate the total…
A: Introduction: Return (after tax) on Equity ratio is a financial performance measuring the…
Q: 2019 2018 Revenue 28,433,361 28,264,711 Cost of sales (23,661,338) (27,476,274) Gross Profit…
A: Earning per share (EPS) ratio shows the per share earning of the company during an accounting year.
Q: TREN Corporation Comparative Income Statements For the years ended December 31, 2015 & 2014 (in…
A: Under vertical analysis, each line item of financial statement is represented as a percentage of…
Q: TREN Corporation Comparative Income Statements For the years ended December 31, 2015 & 2014 (in…
A: Horizontal Analysis Horizontal Analysis is trend analysis of increase and decrease in corresponding…
Q: LOGIC COMPANY Comparative Income Statement For Years Ended December 31, 2017 and 2018…
A: Ratio analysis is a financial accounting technique to measure the overall performance and health of…
Q: Please help
A: Divided each element with the Sales of the particular Year.
Q: Meagley Company presents the following condensed income statement and balance sheet information for…
A: Vertical Analysis - Common Size Statement is also known as the vertical analysis method. The Company…
Q: Consider the following financial statements for Dell Corporation: The closing stock price for Dell…
A: “Since you have posted a question with multiple sub-parts, we will solve first three subparts for…
Q: 12. Using Percentage of Sales. Eagle Sports Supply has the following financial statements. Assume…
A: The finance can be raised through issue of stock by borrowing money or through issuing Debentures.…
Solve the following (Please refer to the picture)

Step by step
Solved in 2 steps


- SCRUMPTIOUS CUPCAKESProfit and loss accountfor the year ended 30 April 20202020£SalesSales 220,000Cost of sales 120,000Gross Profit 100,000ExpensesSalaries 24,000Other Fixed cost 4,800Distribution 3,000Advertising 4,500Rent 13,200AHUtilities 3,600Other Cost 4,00057,100Operating Profit 42,900 SCRUMPTIOUS CUPCAKESBalance Sheetas at 30 April 20202020£Fixed assetsIntangible assets -Tangible assets 35,000Investments -35,000Current assetsStocks 3,000Debtors 10,000Cash at bank and in hand 6,30019,300Written ReportsCreditors: amounts falling duewithin one year (11,300)Net Current Assets 8,000Total assets less currentliabilities 43,000Net Assets 43,000Capital and reservesCalled up share capital 100Profit and loss account 42,900Shareholders' funds 43,000 please calculate the folliwing ratios: Profitability Ratios – Gross Profit Margin, Net Profit Margin and ROCE● Liquidity – Current Test and Acid Test● Gearing● Activity/Performance – Stock Turnover, Debtors’ Collection Period and AssetTurnover…Hello, can you help me in this problem of doing the horizontal analysis. below are the data. Horizontal analysis using: 2016 2017 2018 Sales 227,279 251,589 286,378 Less: Cost of Sales 152,108 168,460 194,236 Gross Profit 75,171 83,129 92,142 Less: Selling and Administrative Expenses 38,128 40,728 46,192 Operating Income 37,043 42,401 45,950 Other income and expenses 268 118 409 Net Income Before Finance Charges and Tax 37,311 42,519 46,359 Less: Finance charges 3,212 2,658 2,998 Net Income Before Tax 34,099 39,861 43,361 Less: Income Tax Expense 10,097 11,635 12,828 Net Income After Tax 24,002 28,226 30,533 using the index numbers: Horizontal Anaysis using index numbers 2016 2017 2018 Sales Less: Cost of Sales Gross Profit Less: Selling and Administrative Expenses Operating Income and the increase/decrease method: horizontal using Increase/decrease method 2016 2017 2018 Operating Income…Gross profit margin ratio: net sales- cost of goods sold/ net sales 386,064- 233,307/ 386,064= .39567= 39.6% (Amazon 2020 year) 280,522- 165,536/ 280,522= .40999= 41% (Amazon 2019 year) 24.1% (Walmart year) Write financial analysis report.
- GIVE THE COMPARATIVE INCOME STATEMENT VERTICAL ANALYSIS FROM THE FOLLOWING INCOME STATEMENT BELOW JOLLIBEE INCOME STATEMENT ITEM 2016 2017 2018 2019 2020 Sales/Revenue 113.81B 133.61B 161.17B 179.63B 129.31B Sales Growth - 17.40% 20.62% 11.45% -28.01% Cost of Goods Sold (COGS) incl. D&A - - 132.96B 150.88B 115.39B COGS Growth - - - 13.47% -23.52% COGS excluding D&A 89.27B 105.39B 121.08B 137.38B 100.82B Depreciation & Amortization Expense 4B 4.75B 11.89B 13.5B 14.57B Depreciation 3.93B 4.66B 11.73B 13.34B 14.32B Amortization of Intangibles 68.99M 78.95M 151.82M 145.42M 245.23M Gross Income 20.54B 23.48B 28.21B 28.75B 13.92B Gross Income Growth - 14.30% 20.12% 1.93% -51.57% Gross Profit Margin - - - - 10.77% SG&A Expense - - 17.64B 20.21B 20.42B SGA Growth - - - 14.57% 1.02%…1. The following information has been taken from the accounting records of Ahmed and Company in first and second period. Period Sales Profit2018 $ 100,000 $15,000 2019 150,000 25,000 Calculate:1) Profit volume ratio 2) Fixed cost for two periods3) Variable cost of two periods.GIVE THE COMPARATIVE INCOME STATEMENT HORIZONTAL AND VERTICAL ANALYSIS FROM THE FOLLOWING INCOME STATEMENT BELOW JOLLIBEE INCOME STATEMENT ITEM 2016 2017 2018 2019 2020 Sales/Revenue 113.81B 133.61B 161.17B 179.63B 129.31B Sales Growth - 17.40% 20.62% 11.45% -28.01% Cost of Goods Sold (COGS) incl. D&A - - 132.96B 150.88B 115.39B COGS Growth - - - 13.47% -23.52% COGS excluding D&A 89.27B 105.39B 121.08B 137.38B 100.82B Depreciation & Amortization Expense 4B 4.75B 11.89B 13.5B 14.57B Depreciation 3.93B 4.66B 11.73B 13.34B 14.32B Amortization of Intangibles 68.99M 78.95M 151.82M 145.42M 245.23M Gross Income 20.54B 23.48B 28.21B 28.75B 13.92B Gross Income Growth - 14.30% 20.12% 1.93% -51.57% Gross Profit Margin - - - - 10.77% SG&A Expense - - 17.64B 20.21B 20.42B SGA Growth - - -…
- GIVE THE COMPARATIVE INCOME STATEMENT HORIZONTAL ANALYSIS FROM THE FOLLOWING INCOME STATEMENT BELOW JOLLIBEE INCOME STATEMENT ITEM 2016 2017 2018 2019 2020 Sales/Revenue 113.81B 133.61B 161.17B 179.63B 129.31B Sales Growth - 17.40% 20.62% 11.45% -28.01% Cost of Goods Sold (COGS) incl. D&A - - 132.96B 150.88B 115.39B COGS Growth - - - 13.47% -23.52% COGS excluding D&A 89.27B 105.39B 121.08B 137.38B 100.82B Depreciation & Amortization Expense 4B 4.75B 11.89B 13.5B 14.57B Depreciation 3.93B 4.66B 11.73B 13.34B 14.32B Amortization of Intangibles 68.99M 78.95M 151.82M 145.42M 245.23M Gross Income 20.54B 23.48B 28.21B 28.75B 13.92B Gross Income Growth - 14.30% 20.12% 1.93% -51.57% Gross Profit Margin - - - - 10.77% SG&A Expense - - 17.64B 20.21B 20.42B SGA Growth - - - 14.57% 1.02%…A company has following details for this yearDetails Total sales($) Total cost($) Details Total sales($) Total cost($)Year ended 31/12/2018 35,78,998 25,89,709Year ended 31/12/2019 48,90,742 31,67,984 Calculate P/V ratio, Fixed cost, break even sales, Margin of safety 2018/2019, Variable cost 2018/2019and percent of fixed cost 2018/201958. The portion of the functional income statements of Brief Company for 2021 and 2020 are presented below: 2021 2020 Sales P890,000 P800,000 Cost of goods sold 530,000 450,000 Gross margin 360,000 350,000 Assuming that the selling price in 2021 is reduced by 11 percent effective January 1, calculate the change in gross profit due to change in unit cost. Group of answer choices P32,500 Favorable P32,500 Unfavorable P25,694 Unfavorable P25,694 Favorable
- Brick & StoneIncome Statement for the year ended 31 December 2016 Notes $ $Sales 2,500,000Cost of Sales 1 1,100,000Gross Profit 1,400,000ExpensesSalaries & Wages 2 760,000Employer NIS Contribution 2,400Rent and Rates 3 240,000Insurance 50,000Maintenance 120,000Depreciation 4…Q3) A. The following information has been taken from the accounting records of Ahmed and Company in first and second period. Period Sales Profit 2019 $ 100,000 $15,000 2020 150,000 25,000 Calculate: 1) Profit volume ratio 2) Fixed cost for two periods 3) Variable cost of two periods.Industry, Delete any companies with missing data for AT, SALE, IB Using Your industry (from question title), please answer these questions using Fiscal year 2015 data, use Total Assets (AT) for average investment, Income Before Extraordinary Items (IB) for income, and Sales/Turnover (Net) (SALE) for Sales Revenue What is the average Sales Margin for your industry? Answer in percentage, to the nearest hundredth of a percent, without the % sign, example 3.45 for 3.45%, 0.45 for 0.45% What is the average Turnover for your industry Answer to the nearest hundredth What is the average Return on Investment for your industry Answer in percentage, to the nearest hundredth of a percent, without the % sign, example 3.45 for 3.45% Which company (use Global Company Key) has the highest ROI in your Industry? Answer with no leading zeros using the appropriate number of digits
