Compute a three- year moving average year No. product 2000 2001 2002 2003 2004 3. 2005 7. 7 ata 6
Compute a three- year moving average year No. product 2000 2001 2002 2003 2004 3. 2005 7. 7 ata 6

Chapter12: Sequences, Series And Binomial Theorem
Section12.3: Geometric Sequences And Series
Problem 12.58TI: What is the total effect on the economy of a government tax rebate of $500 to each household in...

Related questions
Question
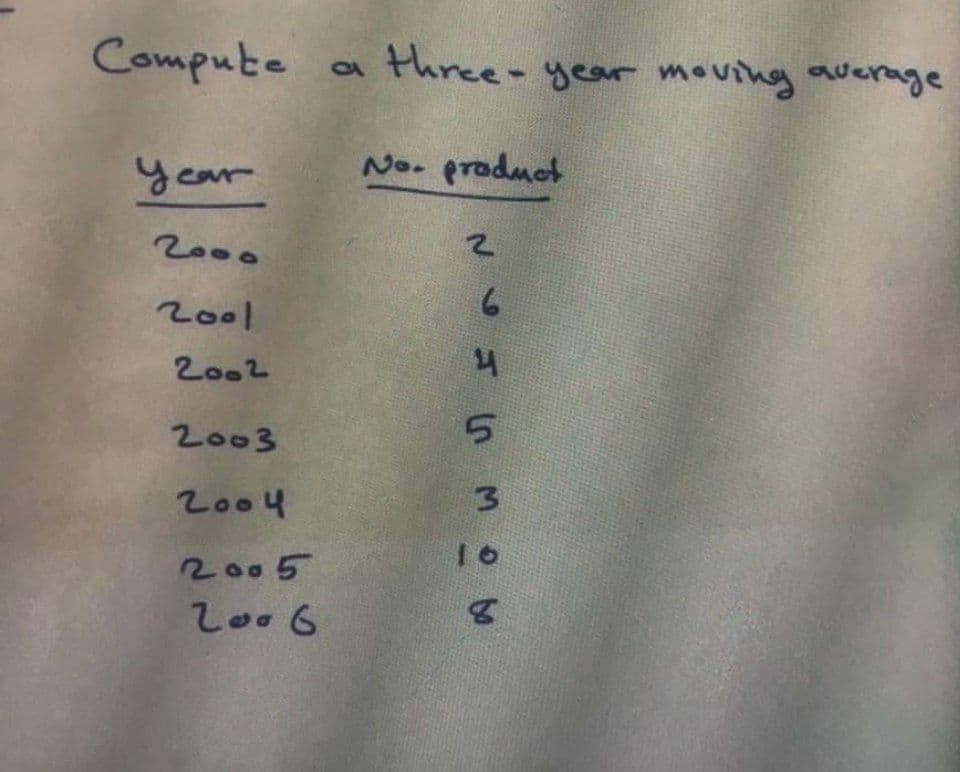
Transcribed Image Text:Compute
a three- year moving average
10
year
No. product
2000
2001
6.
2002
2003
2004
3.
2005
2006
Expert Solution
This question has been solved!
Explore an expertly crafted, step-by-step solution for a thorough understanding of key concepts.

Step by step
Solved in 2 steps

Recommended textbooks for you

Algebra & Trigonometry with Analytic Geometry
Algebra
ISBN:
9781133382119
Author:
Swokowski
Publisher:
Cengage
Algebra & Trigonometry with Analytic Geometry
Algebra
ISBN:
9781133382119
Author:
Swokowski
Publisher:
Cengage