The following data show the quarterly sales for FitRite Auto parts. The goal will be to create a multiplicative time series decomposition forecast. Year Quarter Sales CMA Raw Seasonal Factor 160 180 8. 3 180 190 1.06 4 170 188.75 0.90 1 200 201.25 0.99 2 210 217.5 0.97 3 260 226.25 1.15 4 230 231.25 0.99 1 210 240 10 3 290 4 260 Calculate the CMA and raw seasonal factors for quarters 1 and 2 of Year 10 (there are four missing quantities). Take all calculations, and the answer, to two decimal places. Hint: You will need to compute the CMA values in order to find the raw seasonal factors.
The following data show the quarterly sales for FitRite Auto parts. The goal will be to create a multiplicative time series decomposition forecast. Year Quarter Sales CMA Raw Seasonal Factor 160 180 8. 3 180 190 1.06 4 170 188.75 0.90 1 200 201.25 0.99 2 210 217.5 0.97 3 260 226.25 1.15 4 230 231.25 0.99 1 210 240 10 3 290 4 260 Calculate the CMA and raw seasonal factors for quarters 1 and 2 of Year 10 (there are four missing quantities). Take all calculations, and the answer, to two decimal places. Hint: You will need to compute the CMA values in order to find the raw seasonal factors.

Functions and Change: A Modeling Approach to College Algebra (MindTap Course List)
6th Edition
ISBN:9781337111348
Author:Bruce Crauder, Benny Evans, Alan Noell
Publisher:Bruce Crauder, Benny Evans, Alan Noell
Chapter5: A Survey Of Other Common Functions
Section5.3: Modeling Data With Power Functions
Problem 6E: Urban Travel Times Population of cities and driving times are related, as shown in the accompanying...

Related questions
Question
Dp1
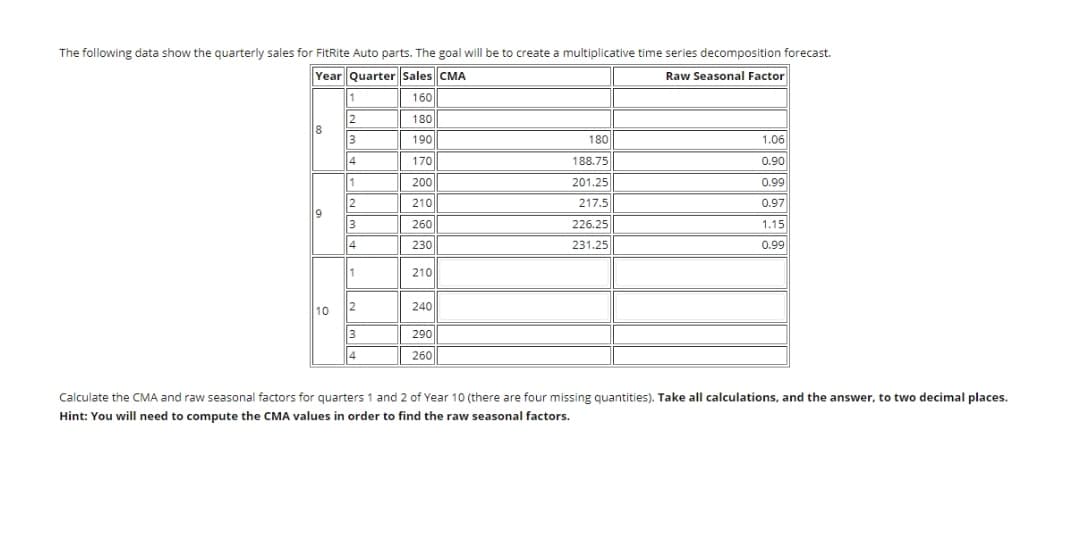
Transcribed Image Text:The following data show the quarterly sales for FitRite Auto parts. The goal will be to create a multiplicative time series decomposition forecast.
Year Quarter Sales CMA
Raw Seasonal Factor
160
2
8
3
180|
190
180
1.06
4
170
188.75
0.90
1
200
201.25
0.99
210
217.5
0.97
9
3
260
226.25
1.15
14
230
231.25
0.99
210
10
2
240
3
290
4
260
Calculate the CMA and raw seasonal factors for quarters 1 and 2 of Year 10 (there are four missing quantities). Take all calculations, and the answer, to two decimal places.
Hint: You will need to compute the CMA values in order to find the raw seasonal factors.
Expert Solution
This question has been solved!
Explore an expertly crafted, step-by-step solution for a thorough understanding of key concepts.

This is a popular solution!

Trending now
This is a popular solution!

Step by step
Solved in 3 steps

Recommended textbooks for you
Functions and Change: A Modeling Approach to Coll…
Algebra
ISBN:
9781337111348
Author:
Bruce Crauder, Benny Evans, Alan Noell
Publisher:
Cengage Learning

Glencoe Algebra 1, Student Edition, 9780079039897…
Algebra
ISBN:
9780079039897
Author:
Carter
Publisher:
McGraw Hill
Functions and Change: A Modeling Approach to Coll…
Algebra
ISBN:
9781337111348
Author:
Bruce Crauder, Benny Evans, Alan Noell
Publisher:
Cengage Learning
Glencoe Algebra 1, Student Edition, 9780079039897…
Algebra
ISBN:
9780079039897
Author:
Carter
Publisher:
McGraw Hill