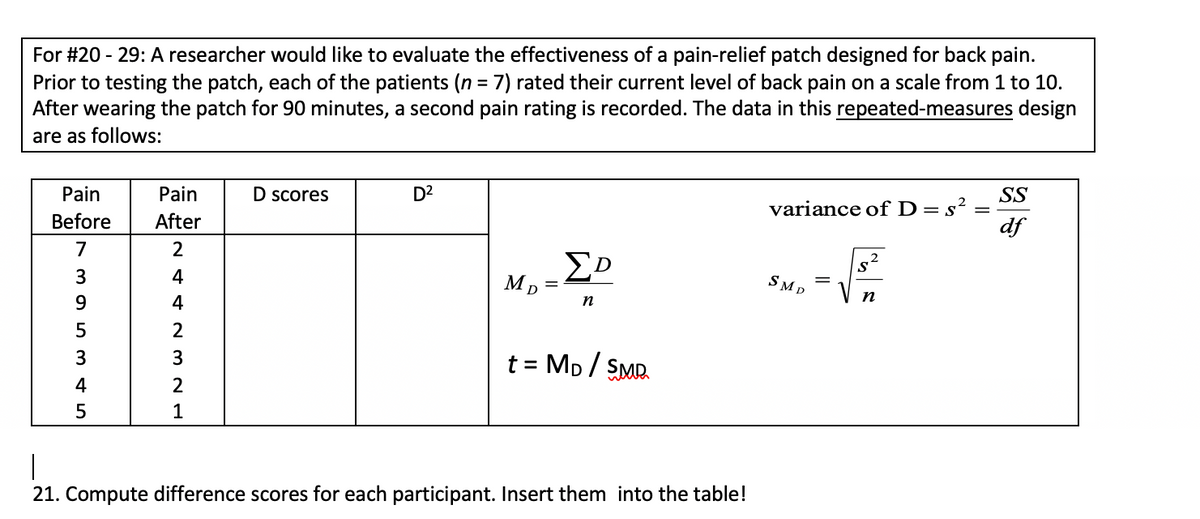
Compute difference scores for each participant. Insert them into the table!


Q: On each trial of an experiment, a subject is presented with a constant soft noise, which is…
A: Arranging Observations in the ascending…
Q: You are conducting a hypothesis test about body temperature where the null hypothesis is that mu is…
A: Given that Null hypothesis H0 : μ≤98.6 Alternative hypothesis H1 : μ>98.6 Hypothesized…
Q: Reliability is the degree to which a test is consistent and stable in measuring what it is intended…
A: Disclaimer : Since you have asked multiple question, we will solve the first question for you. If…
Q: Assume that a randomly selected subject is given a bone density test. Those test scores are normally…
A: Given Those test scores are normally distributed with a mean of 0 and a standard deviation of 1.
Q: The amount of time spent in prison has a mean of 5.2 years and a standard deviation of 1.3 years. A…
A: Consider that μ is the true population mean amount of time spent in prison.
Q: The American Automobile Association (AAA) claims that the proportion of dog owners who have allowed…
A:
Q: zhe pearsou Carrilalion coyfice determenation Calaulate and corygincient of Interpret and diaw megul…
A: Hello! As you have posted more than 3 sub parts, we are answering the first 3 sub-parts. In case…
Q: 1. A sample of the final exam scores in a large introductory math course is as follows 85 60 65 7o…
A: Data : 85,60,65,70,84,75,42,50,75,37,80,73,88,89,85,80,96,99,68,95
Q: 2. Given that Z is the standard NORMAL score, find and SKETCH: a) P (Z-1.6) c) P (-4<Z<1.96)
A: Let Z be the random variable from standard normal distribution with mean = 0 and standard deviation…
Q: Two samples are taken with the following sample means, sizes, and standard deviations x¯1 = 40 x¯2 =…
A:
Q: n = 480 and X = 384, construct a 90% confidence interval for the population proportion, p. Give…
A: Here is given that, n =480 x = 384 We will use one proportion z confidence interval.
Q: In a certain school, 17% of the students are enrolled in a psychology course and 28% are enrolled…
A: Let define the events: A = students are enrolled in a psychology course B = Students are enrolled in…
Q: A university would like to describe the relationship between the GPA and the starting monthly salary…
A:
Q: The hourly rate of 100 college faculty members at Merriam College, Quezon City are distributed…
A: Given data indicates the hourly rate of 100 college faculty members at a college. The objective is…
Q: A manufacturing company that produces laminate for countertops is interested in studying the…
A: Given that
Q: COUNTRY region tfr contraceptors Botswana Africa 4.8 35 Burundi Africa 6.5 9 Cameroon Africa 5.9 16…
A: Since you have asked multiple questions, we will solve the first question for you. If you want any…
Q: Find the expected count and the contribution to the chi-square statistic for the (Group 2, Yes) cell…
A: Given that The two-way table below. Yes No Total Group 1 55 44 99 Group 2 140 60 200…
Q: In a chemical process, the yield is affted by two factors A and B. After multiple regression…
A: Here, we know that r-square is coefficient of determination.
Q: 5. Use the following information to answer the next three exercises. 1; 1; 2; 3; 4; 4; 5; 5; 6; 7;…
A: Given data set is 1,1,2,3,4,4,5,5,6,7,7,8,9sample size(n)=13
Q: Answer the following question. Draw the curve and solve for the unknown. 1. To help students improve…
A: Note: According to Bartleby guidelines expert solve only one question and rest can be reposted.…
Q: Hotpot stoves use a standard oven insulation. To test its effectiveness they take random samples…
A: Given :
Q: What is the Normal Distribution Probability for the following numbers: where X is between 19.94 and…
A:
Q: If all the class frequencies are positive then the data is said to be ______ Answer from the below…
A: If all the class frequencies are positive then the data is said to be ______ Answer from the below…
Q: The mean number of arrivals per minute is 4. Find the probability that (a) no customers are waiting…
A: Hello there, there are multiple subparts in the question, we are solving first three parts for you.…
Q: a. Using the pairs of values for all 10 points, find the equation of the regression line. b. After…
A: a. From the scatterplot the points are (2,9), (4,2), (4,3), (4,4), (5,2), (5,3), (5,4), (6,2),…
Q: The number of books sold weekly for 6 Weeks by a book store 69 65 66 71 68 73 Class Frequency 61-65…
A: Grouped mean =68.833
Q: An electronic manufacturer produces lampshades with a life span of approximately normally…
A: From the provided information, Population standard deviation (σ) = 35 hours
Q: Jllustration 12.4. (Odd number of years.) Taking the original values the actual sales for the years…
A:
Q: Two-Way Classification Designs The data (see picture) shows the yield in an experiment on four…
A: Given :
Q: Y 1 2 14 The analyst now wishes to determine whether this is a good or bad model. To do this, she…
A: Since you have posted a question with multiple subparts, we will solve first three subparts for you.…
Q: A city planner wants to estimate the average monthly residential water usage in the city. He…
A: The confidence interval is an alternative to hypothesis testing.
Q: 6. Assume that the weights of quarters are normally distributed with a mean of 5.67 g and a standard…
A: Given that mu =5.67,s.d =0.07
Q: Edit View History Bookmarks Window Help Save OFF ... SMH 台0 ^G日 Draw Design Layout References…
A: Given Population mean μ=37.5, sample standard deviations s=2.497221, n=10, level of significance…
Q: How much will person pay for 6.2 pounds of bananas at a price of 0.93$ per pounds
A: Given that Number of pounds of bananas = 6.2 pounds Cost per pound of bananas = $0.93 We know…
Q: In the last quarter of 2007, a group of 64 mutual funds had a mean return of 3.9% with a standard…
A: Use the Normal Distribution 68:95:99.7 Rule................
Q: Consider the following data IM 12 14 3 14 5.5 16 Use the given type of regression to find the…
A: a) b) c) d)
Q: There are 225 participating dogs at the National Dog Show that weigh an average of 5 kilos, with a…
A:
Q: 34. Which of the following is an accurate definition of a Type I error? a. Rejecting a false null…
A: We have to check the accurate definition of type l error?
Q: SA study was conducted to determine the effect of ciaarette smoking on the carbon nonoxide diffusing…
A: The random variable diffusing capacity follows normal distribution. We have to construct 90%…
Q: 66.5 160 67.5 110 68.5 50 69.5 20 70.5 5 71.5-72.5 1,000 Test the normality of the distribution.
A:
Q: The following table gives information on GPAS and starting salaries (rounded to the nearest thousand…
A: "Since you have posted a question with multiple subparts, we will solve first 3 sub-parts for you.…
Q: PROBLEM 3 Patients arriving at an outpatient clinic are routinely screened for high blood pressure.…
A: Let there is a sequence of trials, each having two outcomes, say Success and Failure, trials being…
Q: You wish to test the following claim (HaHa) at a significance level of α=0.001 Ho:p1=p2…
A: For the given data Find the test statistic = ? p-value = ? The p-value is... decision to... final…
Q: Suppose a sample of size 2 is randomly selected from the population, with replacement, as follows.…
A: Sampling distribution of the sample mean is an important concept in statistics.
Q: When we are comparing three or more groups we use the.....................................When we…
A: ANOVA (Analysis of Variance) method is used for comparing two or more groups. Correlation…
Q: In the early 2000s interest rates were low so many homeowners refinanced their home mortgages. Linda…
A: Data : 59.2, 59.5, 61.6, 65.5, 66.6, 72.9, 74.8, 77.3, 79.2, 83.7, 85.6, 85.8, 86.6, 87.0, 87.1,…
Q: The table below summarizes a data set that examines the responses of a random sample of college…
A: Given that Yes No Total Support 154 132 286 Oppose 180 126 306 Do not know 104 131 235…
Q: 5. Use the following table to answer the questions asked. Rel. Freq. Cum Rel.Freg Score Frequency 89…
A: We have give the following table Note: According to Bartleby expert guidelines, we can answer only…
Q: Use the following scenario to conduct a hypothesis test. You will again go through the different…
A: Given: p = 0.58 x = 364 n = 682 α = 0.05
Q: An ecologist randomly samples 12 plants of a specific species and measures their heights. He finds…
A: It is given that sample mean is 14 and standard deviation is 3.
21

Step by step
Solved in 2 steps

- For the following exercises, refer to Table 12. Use a graphing calculator to create a scatter diagram of the data.For the following exercises, consider this scenario: The population of a city increased steadily overa ten-year span. The following ordered pairs show the population and the year over the ten-year span (population, year) for specific recorded years: (3,600,2000);(4,000,2001);(4,700,2003);(6,000,2006) 44. What is the correlation coefficient for this model tothree decimal places of accuracy?X Y 1 6 4 1 1 4 1 3 3 1 Which of the following scatterplots accurately depicts this set of scores?
- A study conducted by students in an AP Psychologyclass at South Kent School in Connecticut discovereda correlation of –0.38 between hours of sleep (x) andGPA (y). If we change the variable on the horizontal axisto hours awake (24 - x), but make no change to theGPA data, which of the following would be true aboutthe new scatterplot?A) It slopes down, and the correlation is -0.38.B) It slopes down, and the correlation is +0.38.C) It slopes up, and the correlation is -0.38.D) It slopes up, and the correlation is +0.38.E) None of the above choices is correct.(Source: http://www.cardinalnewsnetwork.org/south-kent-community/sleep-study-sks-style/)A set of n = 10 pairs of scores has ΣX = 20, ΣY = 30, and ΣXY = 74. What is the value of SP for these data?Given that SSxx=265, SSyy=172, and SSxy=184, What is the value of the correlation coefficient?
- for a population with a µ = 60 and σ = 12 Find the z-score for an x value of 75For a population with μ =100 and σ = 20, what is the X value corresponding to z = -0.50?For each problem, select the best response. (a) In a scatterplot of the average price of a barrel of oil and the average retail price of a gallon of gasoline, you expect to see A. a positive association. B. very little association. C. a negative association. D. None of the above. (b) If the correlation between two variables is close to 0, you can conclude that a scatterplot would show A. a cloud of points with no visible pattern.B. no straight-line pattern, but there might be a strong pattern of another form. C. a strong straight-line pattern. D. None of the above. (c) You have data for many years on the average price of a barrel of oil and the average retail price of a gallon of unleaded regular gasoline. When you make a scatterplot, the explanatory variable on the x -axis A. is the price of gasoline. B. can be either oil price or gasoline price. C. is the price of oil. D. None of the above.
- Given that SSxx=213, SSyy=176, and SSxy=180, What is the value of the correlation coefficient? (Round to two decimal places).In general, ___________% of the values in a data set lie at or below the 28 th percentile. _______________ % of the values in a data set lie at or above the 90 th percentile.. If a sample consists of 700 test scores, _________of them would be at or below the 52 th percentile. If a sample consists of 700 test scores, ________ of them would be at or above the 64 th percentile.If r = 0.5 and N = 4, would you conclude that a positive correlationexists between the two variables? Explain your answer. Whatif N = 500?
