zhe pearsou Carrilalion coyfice determenation Calaulate and corygincient of Interpret and diaw megul conclusione grom
zhe pearsou Carrilalion coyfice determenation Calaulate and corygincient of Interpret and diaw megul conclusione grom

MATLAB: An Introduction with Applications
6th Edition
ISBN:9781119256830
Author:Amos Gilat
Publisher:Amos Gilat
Chapter1: Starting With Matlab
Section: Chapter Questions
Problem 1P

Related questions
Question
use no 16 in table 2 whenever necessary. Upvote guaranteed
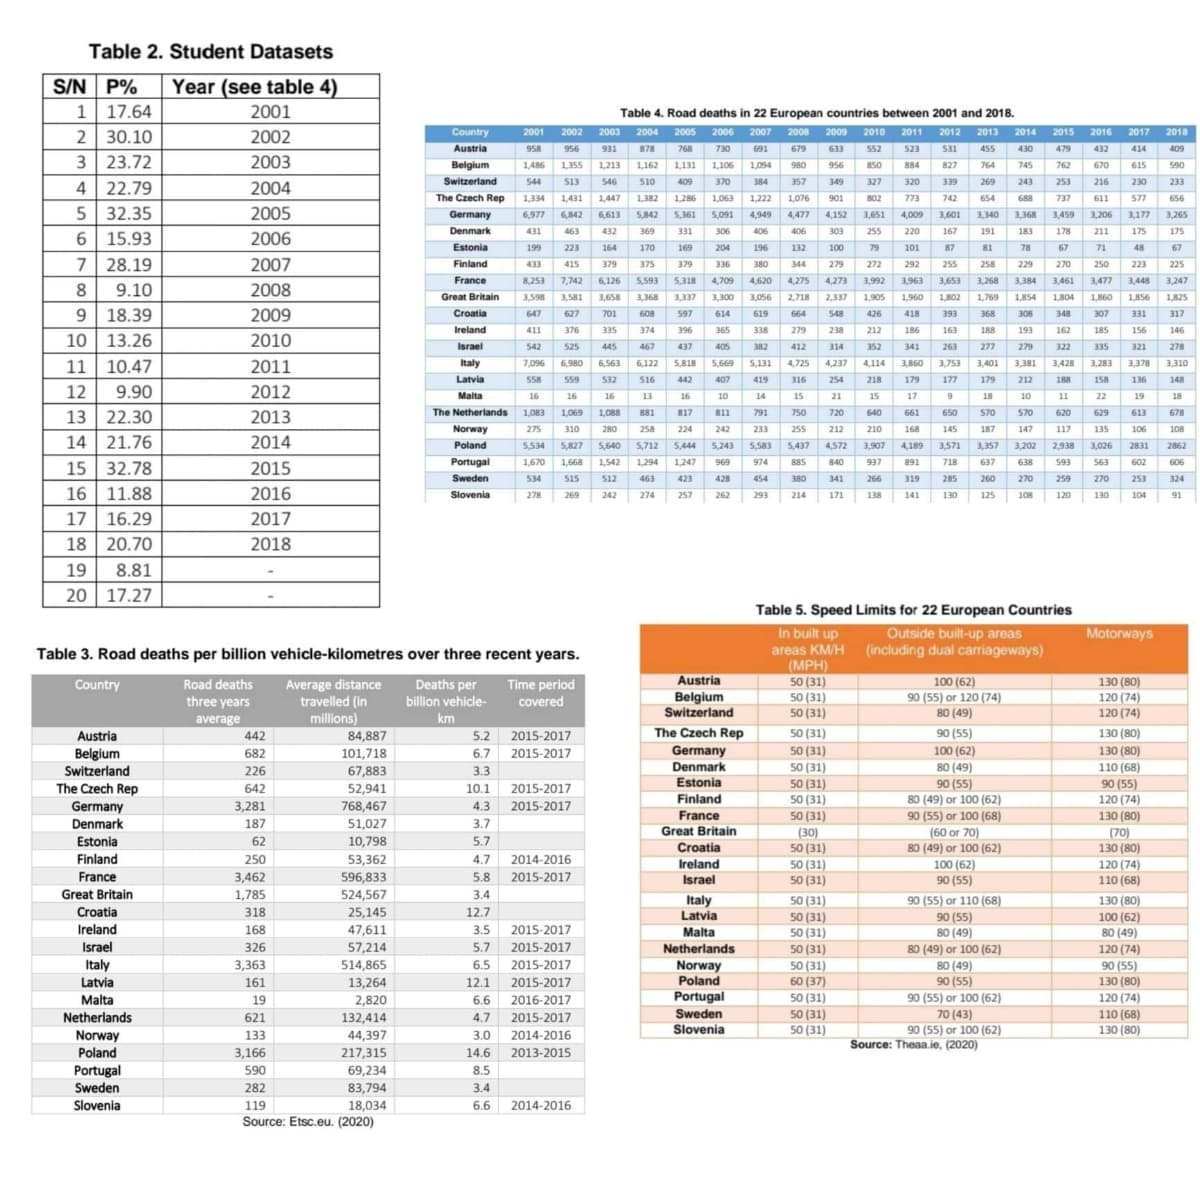
Transcribed Image Text:Table 2. Student Datasets
S/N
P%
Year (see table 4)
1 17.64
2001
Table 4. Road deaths in 22 European countries between 2001 and 2018.
Country
Austria
2
30.10
2002
2001
2002
2003
2004 2005
2006 2007
2008
2009
2010
2011
2012
2013
2014
2015
2016
2017
2018
958
956
931
878
768
730
691
679
633
552
523
531
455
430
479
432
414
409
3
23.72
2003
Belgium
1,486
1,355
1,213
1,162
1,131
1,106
1,094
980
956
850
884
827
764
745
762
670
615
590
Switzerland
544
513
546
S10
409
370
384
357
349
327
320
339
269
243
253
216
230
233
4
22.79
2004
The Czech Rep
1,334
1,431
1,447
1,382
1,286
1,063
1,222
1,076
901
802
773
742
654
688
737
611
577
656
5 32.35
6 15.93
2005
Germany
6,977
6,842
6,613
5,842
5,361
5,091
4,949
4,477
4,152
3,651
4,009
3,601
3.340
3,368
3.459
3.206
3,177
3,265
Denmark
431
463
432
369
406
167
178
175
175
306
406
303
255
220
191
183
211
2006
***
TEE
Estonia
199
223
164
170
169
204
196
132
100
79
101
87
81
78
67
71
48
67
7
28.19
2007
Finland
375
379
279
272
433
415
379
336
380
344
292
255
258
229
270
250
223
225
France
8,253
7,742
6,126
5,593
5,318
4,709
4,620
4,275
4,273
3,992
3,963
3,653
3,268
3,384
3,461
3,477
3,448
3,247
8.
9.10
2008
Great Britain
3,598
3,581
3,658
3,368
3,337
3,300
1,905
1.960
3.056
2,718
2,337
1,802
1,769
1,854
1804
1,860
1,856
1,825
18.39
2009
Croatia
647
627
701
608
597
614
619
664
548
426
418
393
368
308
348
307
331
317
Ireland
411
376
374
396
365
338
279
238
212
186
163
188
193
162
185
156
146
10 13.26
SEE
2010
Israel
542
525
445
467
437
405
382
412
314
352
341
263
277
279
322
335
321
278
10.47
Italy
5,669
11
2011
6,122
5,818
4,237
3,753
3,401
3,381
3,378
3,310
7,096
6,980
6,563
5,131
4,725
4,114
3,860
3,428
3,283
Latvia
558
559
532
516
442
407
419
316
254
218
179
177
179
212
188
158
136
148
12
9.90
2012
Malta
16
16
16
13
16
10
14
15
21
15
17
18
10
11
22
19
18
The Netherlands 1,083
1,069
1,088
881
817
811
791
750
720
640
661
650
570
570
620
629
613
678
13
22.30
2013
Norway
275
310
280
258
224
242
233
255
212
210
168
145
187
147
117
135
106
108
14
21.76
2014
Poland
5,444
3,571
5,534
5,827
5,640
5,712
5,243
5,583
5,437
4,572
3,907
4,189
3,357
3,202
2,938
3,026
2831
2862
15 32.78
2015
Portugal
1,670
1,668
1,542
1,294
1,247
969
974
885
840
937
891
718
637
638
593
563
602
606
Sweden
534
515
512
463
423
428
454
380
341
266
319
285
260
270
259
270
253
324
16
11.88
2016
Slovenia
278
269
242
274
257
262
293
214
171
138
141
130
125
108
120
130
104
91
17
16.29
2017
18
20.70
2018
19
8.81
20 17.27
Table 5. Speed Limits for 22 European Countries
In built up
areas KM/H
Outside built-up areas
(including dual carriageways)
Motorways
Table 3. Road deaths per billion vehicle-kilometres over three recent years.
(MPH)
50 (31)
50 (31)
50 (31)
Austria
Time period
covered
Country
Road deaths
Deaths per
100 (62)
130 (80)
Average distance
travelled (in
millions)
84,887
Belgium
Switzerland
90 (55) or 120 (74)
80 (49)
120 (74)
120 (74)
three years
billion vehicle-
km
average
442
90 (55)
The Czech Rep
130 (80)
50 (31)
50 (31)
50 (31)
Austria
5.2
2015-2017
100 (62)
80 (49)
90 (55)
80 (49) or 100 (62)
Germany
130 (80)
110 (68)
90 (55)
120 (74)
130 (80)
(70)
130 (80)
Belgium
Switzerland
682
101,718
6.7
2015-2017
Denmark
Estonia
67,883
52,941
768,467
51,027
10,798
226
3.3
The Czech Rep
642
10.1
2015-2017
50 (31)
Finland
50 (31)
Germany
Denmark
3,281
4.3
2015-2017
France
Great Britain
Croatia
Ireland
50 (31)
(30)
50 (31)
90 (55) or 100 (68)
187
3.7
(60 or 70
80 (49) or 100 (62)
Estonia
62
5.7
2014-2016
2015-2017
Finland
250
53,362
4.7
3,462
1,785
50 (31)
50 (31)
100 (62)
90 (55)
120 (74)
110 (68)
France
596,833
5.8
Israel
Great Britain
524,567
3.4
50 (31)
50 (31)
50 (31)
90 (55) or 110 (68)
90 (55)
80 (49)
80 (49) or 100 (62)
80 (49)
90 (55)
Italy
Latvia
130 (80)
Croatia
318
25,145
12.7
100 (62)
Ireland
168
47,611
3.5
2015-2017
Malta
80 (49)
Israel
326
57,214
5.7
2015-2017
Netherlands
50 (31)
120 (74)
Italy
3,363
514,865
6.5
2015-2017
Norway
Poland
50 (31)
60 (37)
50 (31)
90 (55)
130 (80)
120 (74)
110 (68)
130 (80)
Latvia
161
13,264
12.1
2015-2017
90 (55) or 100 (62)
70 (43)
90 (55) or 100 (62)
Source: Theaa.ie, (2020)
Malta
19
2,820
6.6
2016-2017
Portugal
Sweden
Slovenia
Netherlands
621
132,414
4.7
2015-2017
50 (31)
Norway
133
44,397
3.0
2014-2016
50 (31)
Poland
Portugal
Sweden
3,166
217,315
14.6
2013-2015
590
69,234
8.5
282
83,794
3.4
Slovenia
18,034
Source: Etsc.eu. (2020)
119
6.6
2014-2016

Transcribed Image Text:Calculate zhe pearson carrlation coyficed
determenation
and corygucient of
Interpret
and diaw
uegul concurione
yrom
your olata .
☺ Using your data , preduct and generate
you years
crasi
data
o crutique the
The data
ump nouements uf any
uu'den
2019- £021.
methord you ve med to internegate
in thisa tast and suggue
: ghia null mqurs
nguire
rexedr ch
yein in th debate about inud jimiti 'and car orach s
au you, are evpectid to
Expert Solution
This question has been solved!
Explore an expertly crafted, step-by-step solution for a thorough understanding of key concepts.

Step by step
Solved in 3 steps with 1 images

Recommended textbooks for you
MATLAB: An Introduction with Applications
Statistics
ISBN:
9781119256830
Author:
Amos Gilat
Publisher:
John Wiley & Sons Inc

Probability and Statistics for Engineering and th…
Statistics
ISBN:
9781305251809
Author:
Jay L. Devore
Publisher:
Cengage Learning

Statistics for The Behavioral Sciences (MindTap C…
Statistics
ISBN:
9781305504912
Author:
Frederick J Gravetter, Larry B. Wallnau
Publisher:
Cengage Learning
MATLAB: An Introduction with Applications
Statistics
ISBN:
9781119256830
Author:
Amos Gilat
Publisher:
John Wiley & Sons Inc
Probability and Statistics for Engineering and th…
Statistics
ISBN:
9781305251809
Author:
Jay L. Devore
Publisher:
Cengage Learning
Statistics for The Behavioral Sciences (MindTap C…
Statistics
ISBN:
9781305504912
Author:
Frederick J Gravetter, Larry B. Wallnau
Publisher:
Cengage Learning

Elementary Statistics: Picturing the World (7th E…
Statistics
ISBN:
9780134683416
Author:
Ron Larson, Betsy Farber
Publisher:
PEARSON

The Basic Practice of Statistics
Statistics
ISBN:
9781319042578
Author:
David S. Moore, William I. Notz, Michael A. Fligner
Publisher:
W. H. Freeman

Introduction to the Practice of Statistics
Statistics
ISBN:
9781319013387
Author:
David S. Moore, George P. McCabe, Bruce A. Craig
Publisher:
W. H. Freeman