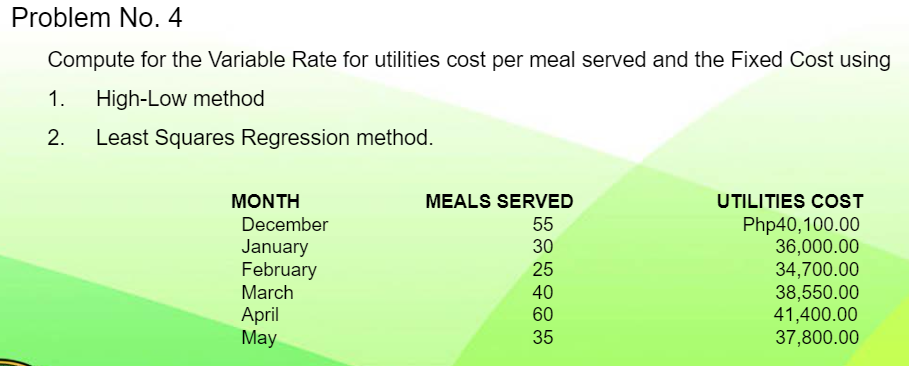
Compute for the Variable Rate for utilities cost per meal served and the 1. High-Low method 2. Least Squares Regression method. MONTH December January February MEALS SERVED 55 30 25 U


Q: A sack contains 10 flash drives. Four of the flash drives are defective. A person removes at random…
A: given data 4 defective drives 6 working drives _________________________ 10 total drives
Q: Let X be a random variable with the following probability distribution. Value x of XP (X=x) -1 0 1 2…
A: Given data is value of x of X P(X=x) -1 0.05 0 0.25 1 0.55 2 0.15
Q: QUESTION 59 A repeated measures ANOVA using 15 participants observed a df-within = 42 and SS-Error =…
A: Given that dfwithin = 42 , SSerror = 20.51
Q: Major Engineering Business Nursing Education RM5000 60 20 5 30
A:
Q: ourse load, English speaking status, family, and weekly hours spent studying. Let's assume that the…
A: Variable descriptionsGender = 0 (male), 1 (female)Major = student's majorAge = age of student in…
Q: e z scores to compare the given values. used on sample data, newborn males have weights with a mean…
A: given data,based on the sample data,new boen male :- μ = 3282.9 x = 1700new born female :-μ =…
Q: (e) State the null and alternative hypotheses for an analysis of variance F-test. O Ho: One or more…
A: to solve last 3 sub part (e,f,conclusion) have to complete ANOVA table first
Q: In an apartment complex the probability a tenant has a dog is 40% and the probability a tenant has a…
A: Answer :- Given P(D) = 0.40, P(C) = 0.37 and P(C∩D) = 0.15 Here P(D) = Probability…
Q: The following are the scores of 30 college students on a statistics test. 75 80 96 79 71 69 81 61 86…
A: Given data…
Q: The average effect size in social psychology is around d = 0.21. Conventionally, a sample over 30…
A: The provided information is as follows: d=0.21n1=30n2=30 Consider the significance level α=0.05.
Q: Table 3.1 lists the total sales (rounded to billions of dollars) of six U.S. companies for 2008.…
A: For the given data of sales in 2008 for 6 companies, We have to calculate mean. Here N=6
Q: 1. Create a pivot table of Gender and Major. Then complete the Joint Probability table so you can…
A: Considering the whole 200 MBA students data: ID Gender Major Employ Age MBA_GPA BS GPA…
Q: You run a regression analysis on a bivariate set of data (n = 80). With a = 78.4 and y = 56.8, you…
A:
Q: There are 8 black balls and 5 red balls and an urn. If 4 balls are drawn without replacement what is…
A: Given no.of black balls = 8no.of red balls = 5Total no.of balls = 13
Q: If there are 144 A's and 384 B's in 1024 observations. How many (i) AB's and (ii) aß's will there be…
A:
Q: Convert each individual data value to a standardized z-score. A. FICO credit scores:. X=562, u=746,…
A: Givenx=562Mean(μ)=746standard deviation(σ)=63
Q: Suppose it is known that the probability of recovery for a certain disease is 0.4. If random sample…
A:
Q: A sample of 30 employees from large companies was selected, and these employees were asked how…
A: The responses are given as: Here, the response "none" is defined to be "not stressful at all".
Q: You wish to test the following claim at a significance level of α = 0.001 H0: p1 = p2 Ha: p1 ≠…
A:
Q: Show that the weighted arithmetic mean of first 'n' natural numbers whose weight are equal to the…
A:
Q: What are the estimated proportions? What are the null and alternative hypothesis? Chapter 7 (see…
A: by bartleby policy i can give only one answer question
Q: The data table to the right represents the volumes of a generic soda brand. Complete parts (a) and…
A: Given volume of sode(oz) is75,70,70,70,50,70,65,70,75,85,75,65,80,80sample size(n)=14
Q: If ß represents the number of units of change in y for every one- unit change in x (i.e. the slope)…
A: Given that,
Q: The following data were obtained for a sample of 10 persons from a height Example and weight…
A: From the provided information, Sample size (n) = 10 ∑xi = 700, ∑yi = 1550, ∑xi2 = 49120, ∑yi2 =…
Q: What is the p-value of a right-tailed one-mean hypothesis test, with a test statistic of z0=2.05?…
A: given data right tailed test z = 2.05 p value = ?
Q: You wish to test the following claim (H₁) at a significance level of a = 0.001. Ho: P₁ = P2 H₁: P₁…
A:
Q: A professor who teaches a large introductory statistics class (197 students) with eight discussion…
A: a) Null Hypothesis: H0: All 8 groups have same mean. Alternative Hypothesis: H1: At least one group…
Q: standard deck with 50 cards — 25 red and 25 black — is shuffled. The probability that the top card…
A: 50 cards in a deck are shuffled. Among those 50 cards 25 are red and 25 are black. Total number of…
Q: Table 3.1 lists the total sales (rounded to billions of dollars) of six U.S. companies for 2008.…
A: The question is about measure of central tendency Given : To find : Mean sales of these six…
Q: .11 Suppose X is a continuous-type random variable with CDF Fx. Let Y be the result of applying Fx…
A:
Q: Use the given data to find the minimum sample size required to estimate the population proportion. A…
A: given data, we have to find minimum sample size required Q-3 E = 0.004 95% CI p^ and…
Q: TON 44 "A clinical psychologist wants to compare the efficacy of medication versus Cognitive…
A:
Q: What is a scatterplot and how does it help us? Choose the correct answer below. O A. A scatterplot…
A: what is a scatter plot and how does it help us ? Select the correct choice ?
Q: You are conducting a test of independence for the claim that there is an association between the row…
A: The problem is relating to Chi-square test for independence of attributes
Q: Question 14: The unemployment rate in a successful European economy is given in the table as a…
A: Unemployment rate For 2016 and 2017 for quarter 1,2,3,4 First we will calculate mean Than we will…
Q: Consider the following data find the value of P(X_>-2).Round your answer to one decimal place
A: Given that x -5 -4 -3 -2 -1 P(X = x ) 0.2 0.3 0.2 0.1 0.2
Q: Determine whether or not the distribution is a discreet possibility distribution and select the…
A: Given data is x 1 6 7 P(X=x) 0.51 0.67 0.35
Q: For a study conducted by the research department of a pharmaceutical company, 245 randomly selected…
A: Data given n1=245 , sample mean x̄1= 17.8 and s1= 4.3 n2=225, sample mean x̄2=18.2 amd s2= 3.60
Q: Find the following t-values in Table 4 of Appendix I or using SALT. (Round your answers to three…
A: As per company guidelines I solved first three subparts of this question .
Q: 2. The municipality of Charlesburg records an average daily water consumption of 998 L per household…
A: Each variable affect by another variable is known as dependent variable. The relationship between…
Q: The object of a general chemistry experiment is to determine the amount (in millilitres [mL]) of…
A: The sampled volume of NaOH (in mL) required to attain the specified pH level is given as: 82.20,…
Q: The cost of ordering new uniforms for a company is based on the number of uniforms ordered. Using…
A:
Q: Find joint moment generating function of the bivariate random variable, (X, Y), M(t₁, 1₂) given that…
A:
Q: The capacities at which U.S. nuclear power plants are working are shown in table for various years.…
A: Given that: The model is given as, ft=0.027t2+0.216t+53.296 Here, f(t) is the capacity t which US…
Q: 5.2643748.qx3zqy7 Jump to level 1 An airline company is interested in improving customer…
A: Given Information: The customer satisfaction rate currently is 54% An airline company is interested…
Q: in a frequency distribution the coefficient of skewed ness based on quartiles is 0.6. it the sum of…
A:
Q: Want to explain these outputs?
A: Normality of the test is used to determine the population follow normal distribution or not. It can…
Q: 2. Rosa will toss a fair coin twice. If you know that the _rst coin toss resulted in heads, what…
A: Given: Rosa will toss a fair coin twice. The first toss results in heads Required: To find the…
Q: iners at a fast food restaurant. How many individuals are luded in the summary? Is it possible to…
A: Time Frequency 62-119 9 120-179 25 180-239 14 240-299 3 300-359 4
Q: "Calculate the pooled variance for the following samples: Sample 1, n = 22 with a sample variance =…
A: It is given that For sample 1, sample size n1 = 22, sample variance = 78.8 For sample 2, sample size…

Step by step
Solved in 3 steps

- Problem 2-28A Estimating fixed and variable cost using the regression method Dean and Powell Tax Services Company has 31 branch offices in the nation. Each office has about three to six professional accountants and one to two secretaries. In a busy season, the office manager, who is also a professional accountant, can hire temporary employees for support work such as document filing and typing. Norman Dean, the president, is wondering whether he should expand his business by opening more offices. One of the factors that he is considering is how to estimate office support costs. Andrea Jones, the accountant, collected the following cost data for all 31 offices. Branch Professional Hours Support Costs Branch Professional Hours Support Costs A1 225 $4,241 F2 165 $3,856 A2 113 3,435 G1 358 5,936 A3 387 6,398 G2 471 8,615 A4 412 6,502 G3 492 9,639 B1 258 4,140 G4 328 5,968 B2 146 3,368 G5 359 7,115 B3 275 3,820 G6 174 3,287 D1…Problem 1: I have uploaded data (PCE-PDI.xls) for the US total personal consumption expenditures and total disposable income from 1971:1 to 2009:7. Divide the entire sample into two subsamples: 1971:01 to 1985:12 and 1986:01 to 2009:07. Here consumption expenditure (PCE) is the dependent variable and disposable income (PDI) is the independent variable. Let variable Y denotes consumption expenditure and variable X denotes disposable income. (a) Estimate a two-variable regression model for both subsamples and report the estimated results.Question 22: A least squares regression line : A- may be used to predict a value of y if the corresponding x value is given. B- implies a cause-effect relationship between c and y. C- can only be determined if a good linear relationship exists between x and y . D- All of these answers are correct.
- 2(a).SSR in linear regression is equal to? SST-SSE SST+SSE SSE-SST SST x SSE SST/SSE correct option? (b).SSE or Sum of square erros show variations in between the populations variations within the populatios Type 1 error Family wise wrror Type 2 error variations within the samples correct option?Is there any multicollinearity problem in the above multiple regression model? How do you know? Risk of Stroke (%) Age Pressure Smoker (Yes=1) 12 57 152 0 24 67 163 0 13 58 155 0 56 86 177 1 28 59 196 0 51 76 189 0 18 56 155 1 31 78 120 0 37 80 135 1 15 78 98 0 22 71 152 0 36 70 173 1 15 67 135 1 48 77 209 0 15 60 199 0 36 82 119 1 8 66 166 0 34 80 125 1 3 62 117 0 37 59 207 1Question 9 of 10, Step 1 of 2 The following table lists the birth weights (in pounds), x, and the lengths (in inches), y, for a set of newborn babies at a local hospital. Birth Weights and Lengths Birth Weight (in Pounds), x 8 7 6 9 10 8 3 3 7 11 Length (in Inches), y 20 18 16 21 19 20 15 16 16 21 Step 1 of 2 : Find an equation of the least-squares regression line. Round your answer to three decimal places, if necessary.
- Which of the following are feasible equations of a least squares regression line for numbers of dollars left in an endowment providing college scholarships in each of its first ten years if it was entirely funded by a single donation? A) y=269,000+8300x. B) y=69,000-8300x. C) y=-269,000-8300x. D) y=269,000-8300x. E) y=0-8300xGiven the bivariate data : x y 0 -0.1 1 -3.3 2 -6.1 3 -9.6 4 -12.2 Find the least squares regression line for the data . Round constants to the nearest hundredth . Use the equation of the least squares line to predict the value of y when x=3.6 .Suppose a study wants to predict the market price of a certain species of turtle (Y) based on the following independent variables indicated in the table. Based from the table, what is the equation of the multiple linear regression? (Round off up to two decimal places. Market Price = 0.07 - 0.40*weight + 1.51*length + 1.41*width + 0.80*age Market Price = - 0.40*weight + 1.51*length + 1.41*width + 0.80*age Market Price = 0.07 + 0.40*weight + 1.51*length + 1.41*width + 0.80*age Market Price = 0.07 - 0.40 + weight + 1.51 + length + 1.41 + width + 0.80 + age
- The operations manager of a musical instrument distributor feels that the demand for Bass Drums may be related to the number of television appearances by the popular rick group Green Shades during the previous month. The manager has collected the data shown in the following table. Demand for Bass Drums 3 6 7 5 10 8 Green Shades TV appearances 3 4 7 6 8 5 Develop the linear regression equation to forecast. Forecast demand for Bass Drums when Green Shades’ TV appearances are 10. Compute MSE and standard deviation for Problem 8.x 5.7 4.1 6.2 4.4 6.5 5.8 4.9 y 1.9 4.8 0.8 3.9 1.2 1.7 3.0 (a) Computethecoefficientofdetermination. (b) Howmuchofthevariationintheoutcomevariableisexplainedbytheleast-squares regression line?Problem 2 The following printout shows the results of a simple linear regression model that predicts monthly sales (in thousands of dollars) based on how much money was spent on advertising (in thousands of dollars) during a particular month for 15 stores of a retail chain. a) Is there a statistically significant relationship between money spent on advertising and sales? Test at the 5% level of significance and explain your approach (including hypotheses). b) Somebody claims that every additional $1,000 in advertising will increase sales by more than $2,000 in the population. Can you find support for this claim given the results of your analysis? Test at the 5% level of significance and explain your approach (including hypotheses). How is this test different from the one in part a)? c) Find a 95% confidence interval for the change in sales given a $1,000 increase in the amount of money spent on advertising. How does this confidence interval relate to your answer to part a)?