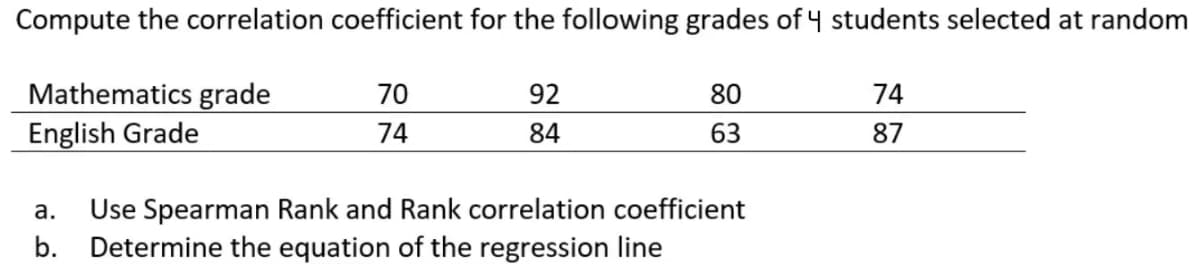
Compute the correlation coefficient for the following grades of 4 students selected at random Mathematics grade 70 92 80 74 English Grade 74 84 63 87 Use Spearman Rank and Rank correlation coefficient b. Determine the equation of the regression line а.


Q: Suppose a doctor measures the height, x, and head circumference, y, of 11 children and obtains the…
A: a) Excel Procedure: Enter X and Y in Excel>Data>Data Analysis> ‘Regression’>Select y…
Q: Here is a bivariate data set. x y 10 246 2 122 54 36 31 -27 -23 7 18 -9 -3 241
A: The table with the calculations is shown below:
Q: ta. b) Assuming a 5% level of significance, use hypothesis testing and the linear correlation…
A: Here heights (in inches) is an explanatory variable (x) and weights (in pounds) is predicted…
Q: Listed below are numbers of Intemet users per 100 people and numbers of scientific award winners per…
A: x y x2 y2 xy 78.3 5.6 6130.89 31.36 438.48 81 8.8 6561 77.44 712.8 57.3 3.3 3283.29 10.89…
Q: Listed below are the overhead widths (in cm) of seals measured from photographs and the weights (in…
A:
Q: Listed below are the overhead widths (in cm) of seals measured from photographs and the weights (in…
A: Use EXCEL to obtain the value correlation coefficient r: EXCEL procedure: Go to EXCEL Go to…
Q: -2 7. 4 21 1 3 15 10 -2 3. -0.885 -0.778 -0.994 -0.671
A: Number of counts (n) = 9 x y x2 y2 xy -2 15 4 225 -30 0 10 0 100 0 7 -2 49 4 -14…
Q: 18) Based on the scatterplot, select the most likely value of the linear correlation coefficient r.…
A:
Q: Listed below are the overhead widths (in cm) of seals measured from photographs and the weights (in…
A: Solution
Q: Listed below are numbers of Internet users per 100 people and numbers of scientific award winners…
A: According to the following information, The data is as follows: X Y 79.9 5.3 80.2 8.7…
Q: Listed below are numbers of Intemet users per 100 people and numbers of scientific award winners per…
A: Given,
Q: Men Women 61.7 42.8 72.6 57.9 55.4 62.1 60.4 74.2 75.3 75.4 49.1 65.2
A: The given data is Men(x) Women(y) 61.7 60.4 42.8 74.2 72.6 75.3 57.9 75.4 55.4 49.1…
Q: You are to analyze the given data from the records of ten students from AMAT167 last school year. 9|…
A: Instruction : "Answer items (a) and (b) only" Given Data : X = Midterm score Y = Final standing…
Q: Listed below are numbers of Internet users per 100 people and numbers of scientific award winners…
A: Given data: Internet users Award winners 78.4 5.5 78.9 9.1 57.1 3.3 67.1 1.6 76.4 11…
Q: Listed below are numbers of Internet users per 100 people and numbers of scientific award winners…
A:
Q: For a sample of 12 observations, a businessman wants to regress the price (in dollar) of the laptop…
A: Given data is,
Q: Compute the Pearson correlation for the following data. X Y 2 3 3 1 6 5 4…
A:
Q: Listed below are the overhead widths (in cm) of seals measured from photographs and the weights (in…
A: Solution a) construct scatter plot Answer : Option A) shows scatter plot b) Linear correlation…
Q: listed below are numbers of Internet users per 100 people and numbers of scientific award winners…
A: Given data shows numbers of Internet users per 100 people and numbers of scientific award winners…
Q: Listed below are numbers of Internet users per 100 people and numbers of scientific award winners…
A: Solution 1) Construct a scatter plot
Q: Suppose a doctor measures the height, x, and head circumference, y, of 11 children and obtains the…
A: From the provided information, The correlation coefficient (R) = 0.914 a) The required coefficient…
Q: Listed below are the overhead widths (in cm) of seals measured from photographs and the weights (in…
A: Consider that overhead width is x and weight is y.
Q: The following table shows the approximate number of wireless telephone subscriptions in a certain…
A: Year 2005 2006 2007 2008 2009 2010 Subscriptions in millions 194 218 243 261 275 291 Linear…
Q: Here is a bivariate data set. y 53.8 65.3 72.5 5.5 88 -15.5 71 53.3 54.1 70.6 50.2 71.9 38.9 109.1…
A: The formula of correlation is,
Q: The table below shows the final marks in Mathematics and English obtained by 10 students selected at…
A: 1) Correlation: Correlation a measure which indicates the “go-togetherness” of two data sets. It can…
Q: Listed below are the overhead widths (in cm) of seals measured from photographs and the weights…
A:
Q: Listed below are the overhead widths (in cm) of seals measured from photographs and the weights (in…
A:
Q: "Based on their results, a researcher makes the interpretration that variable A is not associated…
A: Given that The interpretation that the variable A is not associated with variable B to any…
Q: ro A manufacturer wants to measure the relationship between the sweetness index (y) of peach juice…
A: Given : Sample correlation (r) : Given : Y X 5.7 231 5.5 227 5.3 259 5.9 210 5.8 224…
Q: Listed below are numbers of Internet users per 100 people and numbers of scientific award winners…
A:
Q: The systolic blood pressure of individuals is thought to be related to both age and weight. For a…
A: Relative to mean the variable which has higher CV has higher spread and lower CV has lower spread So…
Q: Listed below are the overhead widths (in cm) of seals measured from photographs and the weights…
A: Scatterplot: Step by step procedure in EXCEL: Step-1: Select the…
Q: wVI AL - Compute the correlation coefficient of the following bivariate data. Then, give a…
A: According to our policy we can answer only first part for remaining please repost the question
Q: Compute the Pearson correlation for the following data. х 2. 3 6 4 5 Y 3 1 5 4 2.
A: Solution:Mean ˉx=∑xi/n=(2+3+6+4+5)/5=20/5=4Mean ˉy=∑yi/n=(3+1+5+4+2)/5=15/5 =3
Q: Compute the Pearson correlation for the following data and then test its significance. X Y 2…
A: The independent variable is X. The dependent variable is Y. The given data represents simple linear…
Q: For the data given in the table below, find the linear correlation coefficient r and the…
A:
Q: Suppose a doctor measures the height, x, and head circumference, y, of 11 children and obtains the…
A:
Q: Compute the correlation coefficient, r.
A: The correlation coefficient formula is, r=n∑ixy-∑ix∑iyn∑ix2-∑ix2n∑iy2-∑iy2 The sums are, Chest(x)…
Q: Listed below are the overhead widths (in cm) of seals measured from photographs and the weights (in…
A: From given data, X Y X*Y X*X Y*Y 7.1 114 809.4 50.41 12996 7.6 180 1368 57.76 32400 9.8 248…
Q: A student of Engineering conducted a research to determine the correlation between performance of 2…
A: Given that Let X denotes performance of Lathe A and Y denotes the performance of Lathe B We have…
Q: A random sample of 7 countries gave the following figures for X = annual per capita income and Y =…
A: (1) Use EXCEL to obtain the value correlation coefficient r: EXCEL procedure: Go to EXCEL Go…
Q: Age 41 45 49 69 73 Bone Density 360 350 345 335 330 Copy Data Step 1 of 3: Calculate the correlation…
A:
Q: Listed below are numbers of Internet users per 100 people and numbers of scientific award winners…
A: Solution a) Option c) shows correct scatter plot c) linear correlation coefficient r= 0.783…
Q: of two personnel evaluation techniques available, the first requires a 2-hour test-interview while…
A: Given data: Test 1 (x) Test 2 (y) 75 38 90 56 60 35 71 46 92 58 106 69 55 30 87…
Q: 3.Calculate the regression and coefficient of correlation from the following data S. No Subject…
A: Correlation means the relationship between two variables where with the changes in the values of one…
Q: study of bone density on 5 random women at a hospital produced the following results. Age 33 37 49…
A:
Q: You are to analyze the given data from the records of ten students from AMAT167 last school year. 3|…
A: Here we should find the standard error of the estimate. Please find the solution below.
Q: The following table shows the hours studied and corresponding test grade earned by students on a…
A: Use EXCEL to obtain the value correlation coefficient r: EXCEL procedure: Go to EXCEL Go to…
Q: The following table shows the approximate number of wireless telephone subscriptions in a certain…
A: a)Here, x y x-x y-y (x-x)(y-y) (x-x)2 (y-y)2 2005 192 -2.5 -56 140 6.25 3136 2006 218 -1.5…
Q: Listed below are numbers of Internet users per 100 people and numbers of scientific award winners…
A: Scatter plot :

Step by step
Solved in 2 steps

- 4. For a sample of 12 observations, a businessman wants to regress the price (in dollar) of the laptop (Y) on the processor's speed (X). The summary results of the observations are given below. Σx = 19.8 , Σy = 24798, Σxy = 431882 Σx^2 = 3388, Σγ^2 = 57365692 a) compute correlation coefficient (b) Find the fitted regression line of the price of laptop on processor speed.Suppose a doctor measures the height, x, and head circumference, y, of 11 children and obtains the data below. The correlation coefficient is 0.904 and the least squares regression line is y=0.208x+11.736. Complete parts (a) and (b) below.on the basis of the value of linear correlation coefficient, would you conclude, at the /r/>0.9 level, that the data can be reasonably modeled linear equation?
- An experiment was run and the following data table was produced: (a) Calculate the correlation coefficient for the data. Is the data positivelyor negatively correlated, and is that correlation weak, moderate, or strong?(b) Find the equation of the least squares regression line and plot the lineon top of a scatterplot of the data.The following table lists heights (in inches) and weights (in pounds) for 9 supermodels:Height (in.)_x__|__71____70.5____71____72____70____70____66.5____70____71_Weight (lb) y | 125 119 128 128 119 127 105 123 115 Plot the scatter diagram for the paired data.b) Assuming a 5% level of significance, use hypothesis testing and the linear correlationcoefficient (r) to determine if there is a linear correlation. α = 0.05 c) Find the equation of the regression line and plot it on your scatter diagram using an x of 68and an x of 71. d) Determine the residual value for an x of 70.5 and explain its meaning. e) Determine the coefficient of determination and explain its meaning.The table below gives the list price and the number of bids received for five randomly selected items sold through online auctions. Using this data, consider the equation of the regression line, Y=b0+b1x, for predicting the number of bids an item will receive based on the list price. Keep in mind, the correlation coefficient may or may not be appropriate to use the regression line to make a prediction if the correlation coefficient is not statistically significant. Price in dollars 109 113 155 167 170 Number of Bids 10 11 12 13 17 Summation Table X Y XY X2 Y2 BID 1 109 10 1090 11881 100 BID 2 113 11 1243 12769 121 BID 3 155 12 1860 24025 144 BID 4 167 13 2171 27889 169 BID 5 170 17 2890 28900 289 SUM 714 63 9254 105464 823 Step 1: Find the estimated slope. Step 2: Find the estimated y-intercept. Step 3: Find the estimate value of y when x=113. Step 4: Determine if the statement "All points predicted by the linear model fall on the same line" is true or…
- The table below gives the number of hours five randomly selected students spent studying and their corresponding midterm exam grades. Using this data, consider the equation of the regression line, Y=b0+b1x, for predicting the number of bids an item will receive based on the list price. Keep in mind, the correlation coefficient may or may not be appropriate to use the regression line to make a prediction if the correlation coefficient is not statistically significant. Hours Studying 0 1 2 3 4 Number of Bids 73 79 87 88 97 Summation Table X Y XY X2 Y2 Student 1 0 73 0 0 5329 Student 2 1 79 79 1 6241 Student 3 2 87 174 4 7569 Student 4 3 88 264 9 7744 Student 5 4 97 388 16 9409 SUM 10 424 905 30 36292 Step 1: Find the estimated slope. Step 2: Find the estimated y-intercept. Step 3: Determine if the statement "All points predicted by the linear model fall on the same line" is true or false. Step 4: Substitute the values you found in steps 1 and 2 into the…The table below gives the list price and the number of bids received for five randomly selected items sold through online auctions. Using this data, consider the equation of the regression line, Y=b0+b1x, for predicting the number of bids an item will receive based on the list price. Keep in mind, the correlation coefficient may or may not be appropriate to use the regression line to make a prediction if the correlation coefficient is not statistically significant. Price in dollars 31 38 42 44 46 Number of Bids 3 4 6 7 9 Summation Table X Y XY X2 Y2 BID 1 31 3 93 961 9 BID 2 38 4 152 1444 16 BID 3 42 6 252 1764 36 BID 4 44 7 308 1936 49 BID 5 46 9 414 2116 81 SUM 201 29 1219 8221 191 Step 1: Find the estimated slope. Step 2: Find the estimated y-intercept. Step 3: Determine the value of the dependent variable Y at x=0. Step 4: Find the estimate value of y when x=42. Step 5: Substitute the values you found in steps 1 and 2 into the equation for the…a) Calculate the least square regression line for X on Y of the given data?b) Calculate the coefficient of correlation of the given date? Interpret the value of the coefficient?
- A researcher would like to predict the dependent variable Y from the two independent variables X1 and X2 for a sample of N=15 subjects. Use multiple linear regression to calculate the coefficient of multiple determination and test the significance of the overall regression model. Use a significance level α=0.02. X1 X2 Y 55.1 69.4 72.2 31.4 54.3 36.2 57.9 50 103.4 41.3 53.7 43.9 50.7 36.6 98.5 50.1 53.3 65.3 39.8 60.5 55.2 59.6 80.8 43.6 24.2 8.2 77 32.4 69.8 31 34.4 35.3 82.6 70.3 79.6 66.2 31.5 36.1 43.6 42.3 48.7 73.3 25.9 70.2 21.6 SSreg=SSres= R2= F=P-value = What is your decision for the hypothesis test? Reject the null hypothesis, H0:β1=β2=0 Fail to reject H0 What is your final conclusion? The evidence supports the claim that one or more of the regression coefficients is non-zero The evidence supports the claim that all of the regression coefficients are zero There is insufficient evidence to support the claim that at least one of the…The sample correlation coefficient is equal to the covariance of x and ydivided by the square root of the product of sx2 times sy2. True FalseYears of Work Experience and number of Job Offers of 10 job-seekers were as follows: Work Exp. 4 2 5 3 7 12 2 5 4 9 No. of Offers 7 1 8 4 13 19 3 11 9 15 a. Fit the regression equation of No. of Job Offers on Years of Work Experience. b. What will be the predicted number of offers for an applicant with 6 years of experience? c. Verify the relationship between the number of job offers and years of work experience using at least two relevant methods