Age 41 45 49 69 73 Bone Density 360 350 345 335 330 Copy Data Step 1 of 3: Calculate the correlation coefficient, r. Round your answer to six decimal places.
Age 41 45 49 69 73 Bone Density 360 350 345 335 330 Copy Data Step 1 of 3: Calculate the correlation coefficient, r. Round your answer to six decimal places.

Glencoe Algebra 1, Student Edition, 9780079039897, 0079039898, 2018
18th Edition
ISBN:9780079039897
Author:Carter
Publisher:Carter
Chapter10: Statistics
Section10.1: Measures Of Center
Problem 9PPS

Related questions
Question
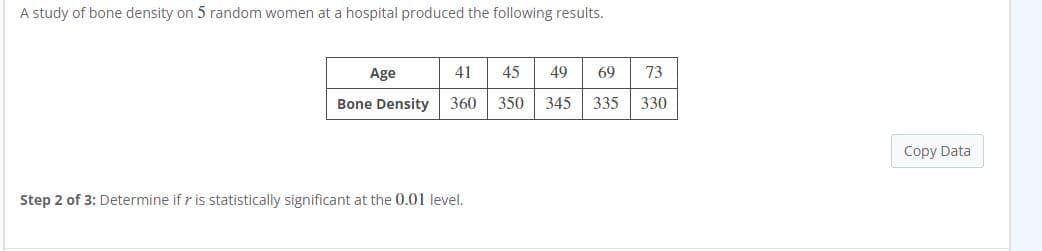
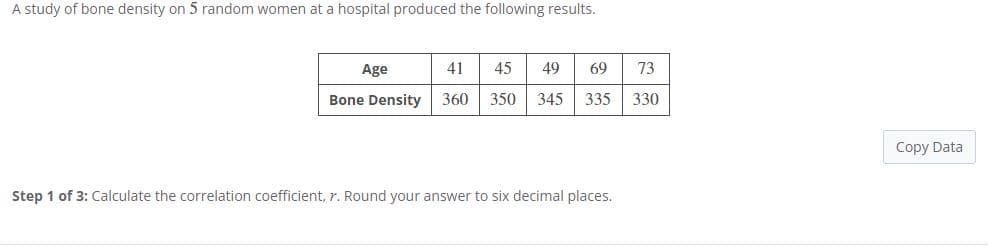
A study of bone density on 5 random women at a hospital produced the following results.
Age 41 45 49 69 73
Bone Density 360 350 345 335 330
Step 3 of 3: Calculate the coefficient of determination, r2. Round your answer to three decimal places.
Transcribed Image Text:A study of bone density on 5 random women at a hospital produced the following results.
Age
41
45
49
69
73
Bone Density
360
350
345
335
330
Copy Data
Step 2 of 3: Determine if r is statistically significant at the 0.01 level.
Transcribed Image Text:A study of bone density on 5 random women at a hospital produced the following results.
Age
41
45
49
69
73
Bone Density
360
350
345
335
330
Copy Data
Step 1 of 3: Calculate the correlation coefficient, r. Round your answer to six decimal places.
Expert Solution
This question has been solved!
Explore an expertly crafted, step-by-step solution for a thorough understanding of key concepts.

This is a popular solution!

Trending now
This is a popular solution!

Step by step
Solved in 3 steps with 3 images

Recommended textbooks for you
Glencoe Algebra 1, Student Edition, 9780079039897…
Algebra
ISBN:
9780079039897
Author:
Carter
Publisher:
McGraw Hill
Glencoe Algebra 1, Student Edition, 9780079039897…
Algebra
ISBN:
9780079039897
Author:
Carter
Publisher:
McGraw Hill