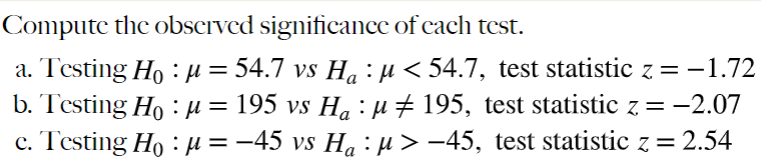
Compute the observed significance of each test. a. Testing Hoμ = 54.7 vs H₁ b. Testing Hoμ = 195 vs H₁ c. Testing Hoμ = −45 vs H₁ μ< 54.7, test statistic z = -1.72 μ‡ 195, test statistic z = -2.07 μ> -45, test statistic z = 2.54


Q: Suppose you an analyzing a large one-way ANOVA test to investigate differences between multiple…
A: For the given data Find MST =?
Q: The life in hours of a battery is known to be approximately normally distributed, with standard…
A:
Q: Suppose you are an educational researcher, and want to investigate the prefer of students for fully…
A:
Q: The table below shows the distribution, by marital status and gender, of the population of a certain…
A:
Q: 250 adults are practicing every day before taking part in a high-stakes children's game. The game…
A:
Q: wants to create a 99% confidence interval around the sample mean. What is the upper bound of the…
A: Here use t - critical for confidence interval because population standard deviation is unknown
Q: Which of the following statements below is incorrect about Type II error? The larger the effect…
A: Here, to check whether the given statements about the type II error are correct or incorrect.
Q: Statistics students in Oxnard College sampled 11 textbooks in the Condor bookstore and recorded the…
A: A student calculates a linear model using technology (Statistics Calculator or Computer)ˆy= _ _ _ x…
Q: The joker is getting ready for a card trick for Harley Quinn. A card is selected randomly from a…
A: No. of cards in a standard deck=52 No. of hearts=13 No. of club=13 No. of diamond=13 No. of spade=13
Q: An auto shop wants to examine the proportion of customers that have to return after an appointment.…
A:
Q: Determine whether the following problem involves a permutation or a combination and explain your…
A: Given letters is O,P,Q,R,S,T and UTotal no.of letters =7
Q: part in a hearing experiment. Among other things, the absolute hearing threshold (in decibels) was…
A: A data set is given here By using frequency table we make histogram.
Q: You are a member of a club on campus. As part of the club's fundraising activities, you sell…
A:
Q: The piston diameter of a certain hand pump is 0.5 inch. The manager determines that the diameters…
A: Given: Population sd, σ=0.005Sample sd, s=0.0034Sample size, n=25σ=0.10
Q: You are a sales manager for a large vending machine company, and you are experimenting with…
A: Assume that the β1 is the population slope coefficient.
Q: need standard deviation p
A:
Q: A set of data items is normally distributed with a mean of 90 and a standard deviation of 4 Convert…
A: Solution
Q: Male(x₂) 80 83 78 84 90 88 82 85 89 82 85 12 86 Total Mean STEP 1: Make a hypothesis Ho: Ha: No 1 2…
A: We need to test, if there is any significant difference in the performance in Basic Calculus of the…
Q: Test the claim about the difference between two population means μ₁ and μ₂ at the level of…
A:
Q: Example 20.9 Suppose we have the following two indices, Index A with base year 1990 = 100 and Index…
A:
Q: The life expectancy in the united states is 75 with a standard deviation of 7 years. A random sample…
A: As per our company guidelines we are supposed to answer only first 3 sub-parts. Kindly repost other…
Q: Data showing the population by state as of 2012 in millions of people follow (The World Almanac). No…
A: Given Information: Consider the given data that shows the population by state in millions of people.
Q: An auto shop wants to examine the proportion of customers that have to retur after an appointment.…
A: Given that Sample sizes n1=402 , n2=319 Sample proportion p1^=0.224 , p2^=0.251
Q: The student needs a minimum score of 72.25 fourth test to ensure a grade of at least a C. x on the
A: We have given that the first three test scores of students 67.75, 66 and 72
Q: You are a process engineer for a company that manufactures widgets. A particular machine at your…
A:
Q: 1) What percentage of sufferers estimate that their colds lasted for longer than forty-eight hours?…
A: here given , An investigator polls a representative sample of common cold sufferers, asking them to…
Q: Multiple myeloma, or blood plasma cancer, is characterized by increased blood vessel formulation…
A:
Q: 4. You study the determinants of attending college. You run a linear probability model: College…
A:
Q: A researcher is interested in the idea of a Protestant work ethic. She conducts random survey on…
A: From the given information, the researcher is interested in the idea of a protestant work ethic.…
Q: An agent for a residential real estate company in a large city has the business objective of…
A: Given: Size Rent 850 1950 1450 2600 1085 2200 1232 2500 718 1950 1485 2700 1136…
Q: If we sample from a small finite population without replacement, the binomial distribution should…
A: In question, Given formula of probability of hypergeometric distribution with unknown constant. Then…
Q: (a) Calculate a point estimate of the mean pull-off force of all connectors in the population (Round…
A: Since you have posted a question with multiple sub-parts, we will solve first three subparts for…
Q: Suppose that you are taking a course where the total class grade is the weighted average of your…
A:
Q: You are the manager of a local cinema, and want to investigate how much the average customer spends…
A:
Q: As part of a university club, you decide to investigate how much other students at the university…
A: Given that Sample size n =27 Sample mean =803.95 Sample standard deviation =157.20
Q: You are analyzing a dataset with 932 datapoints. You decide to create a linear regression model with…
A: Given: No. of observation, n=932 No. of predictors, k=18
Q: This problem involves empirical probability. The table shows the breakdown of 91 thousand single…
A: Given data, P(Randomly selected is Female)=?
Q: Do shoppers at the mall spend the same amount of money on average the day after Thanksgiving…
A:
Q: 4.2.19. Let X₁, X2,.... X be a random sample from a gamma distribution with known parameter a = 3…
A:
Q: Example 20.2 Using the data given in Table 20.2, calculate the price index for year 2, the base year…
A:
Q: 3. Fixed effects regression assumptions and standard errors (a) What are the four assumptions for…
A:
Q: Answer Suppose you are analyzing a dataset of 209 datapoints for using in a multiple regression…
A: Given that SSE=218485 And SSR=109225
Q: Example 20.13 The following table gives prices and quantities for the base year and the current year…
A:
Q: You are analyzing a confidence interval using a 90% confidence level in your analysis. You collect a…
A: Obtain the upper bound of the 90% confidence interval for the population proportion. The upper bound…
Q: Use the Fundamental Counting Principle to solve. An ice cream store sells 5 drinks, in 5 sizes, and…
A: Given data,No of drinks =5No of sizes =5No of flavours =3In how many ways can a customer order a…
Q: A ship leaves port at noon and travels at a bearing of 214". The ship's average rate of speed is 15…
A:
Q: For planning students financial aid, the university Financial Aid office needs to know how much a…
A: As per our guidelines we can solve first three sub part of question and rest can be reposted.…
Q: 1. How many license plates can made where the first character is a number from 0 to 9, followed by…
A:
Q: The probability that a certain PBA import can hit a three-point shot is 30%. What is the probability…
A:


Trending now
This is a popular solution!

Step by step
Solved in 4 steps with 6 images

- Prior to assessment of the outcome, the researchers did a manipulation check. Members of Groups 1 and 2 rated the attractiveness (on a 1 to 9 scale, with 9 being the most attractive) of the person in the photo. They reported that for the attractive photo, M = 7.53; for the unattractive photo, M = 3.20, F (1, 108) = 184.29. Was this difference statistically significant (using = .05 )? The p value F(1,108) = 184.29 is less than 0.0001. Therefore, the difference is statistically significant because the p value is much less than .05 What was the effect size for the difference in (2a)?Prior to assessment of the outcome, the researchers did a manipulation check. Members of Groups 1 and 2 rated the attractiveness (on a 1 to 9 scale, with 9 being the most attractive) of the person in the photo. They reported that for the attractive photo, M = 7.53; for the unattractive photo, M = 3.20, F(1, 108) = 184.29. Was this difference statistically significant (using a =.05)? What was the effect size for the difference in (2a)? Was their attempt to manipulate perceived attractiveness successful? Why does the F ratio in (2a) have just df=1 in the numerator?31% of all pygmy softshell toises have stripes on their shells. A herpetologist in Cititon collects a sample of 28 pygmy softshell tortoises and finds that 8 of them have stripes on their shells. Is there enough evidence to conclude, at a significance of alpha=0.05, that the proportion of pygmy softshell tortoises in Cititon with stripes on their shells is less than 31%? What is the claim? What is the null hypothesis? What is the alternative hypothesis? What is the test statistic? What is/are the critical value(s)? Do we reject the null hypothesis? What conclusion do we draw? What is the P-value for the problem above?
- Given a critical t score of -2.33 and t observed being -2.01, the decision you should make is reject Ho retain Ho conduct another test using a larger sample size retain HaA sample of men and women who had passed their driver's test either the first time or the second time were surveyed, with the following results: Results of the driving testGender First time Second timeMen 126 211Women 135 178a) Do these data suggest that there is a relationship between gender and the passing of their driver’s test from which the present sample was drawn? Let alpha=.05Below are the results for the three periods between the USA Stock and the USA Treasuary Bills. The complete sample, January 1950 to December 2017. Correlation = -0.159596558 The subsample, January 1950 to December 1969. Correlation = -0.262086255 The subsample, January 1970 to December 2017. Correlation = -0.142338644 required, interprete the meaning of the results and if the null hypothesis was that the colerration is 0 would that be true?
- Listed below are the lead concentrations in muμg/g measured in different traditional medicines. Use a 0.010.01 significance level to test the claim that the mean lead concentration for all such medicines is less than 1717 muμg/g. Assume that the lead concentrations in traditional medicines are normally distributed. 1010 13.513.5 16.516.5 19.519.5 2121 13.513.5 3.53.5 22.522.5 1313 3.53.5 What are the null and alternative hypotheses? A. Upper H 0H0: muμequals=1717 muμg/g Upper H 1H1: muμless than<1717 muμg/g B. Upper H 0H0: muμequals=1717 muμg/g Upper H 1H1: muμgreater than>1717 muμg/g C. Upper H 0H0: muμequals=1717 muμg/g Upper H 1H1: muμnot equals≠1717 muμg/g D. Upper H 0H0: muμgreater than>1717 muμg/g Upper H 1H1: muμless than<1717 muμg/g Determine the test statistic. (Round to two decimal places as needed.) Determine the P-value. (Round to…Consider the following measurements of blood hemoglobin concentrations (in g/dL) from three human populations at different geographic locations: population1 = [ 14.7 , 15.22, 15.28, 16.58, 15.10 ] population2 = [ 15.66, 15.91, 14.41, 14.73, 15.09] population3 = [ 17.12, 16.42, 16.43, 17.33] What is the standard error of the difference between the means of population 2 and population 3, needed to calculate the Tukey-Kramer q-statistic? What is the Tukey-Kramer q-statistic for populations 2 and 3? (Report the absolute value, if you get a negative number, multiply by -1)5.39 ● The following data on degree of exposure to 242Cmalpha particles (x) and the percentage of exposed cellswithout aberrations (y) appeared in the paper “Chromosome Aberrations Induced in Human Lymphocytes by D-TNeutrons” (Radiation Research [1984]: 561–573):
- Also, using α = .05, run a two-tail t-test for one sample to test Ho: µ=283 for the 2009 scores. Report the t-obt, df, and p-values. Would you reject the null hypothesis that the 2009 scores come from a population with average 283? If this is the case, does it come from a population from larger or smaller average?The NAEP considers that a national average of 283 is an acceptable performance. Using α = .05, run a two-tail t-test for one sample to test Ho: µ=283 for the 2019 scores. Report the t-obt, df, and p-values. Would you reject the null hypothesis that the 2019 scores come from a population with average 283? If this is the case, does it come from a population from larger or smaller average?Suppose you will perform a test to determine whether there is sufficient evidence to support a claim of a linear correlation between two variables. Find the critical values of r given n = 11 at a significance level of 0.05. ±± 0.575 ±± 0.514 ±± 0.555 ±± 0.602